Spectrum Monitor
30.1 Understanding Spectrum Data
SCALANCE W1750D UI
Configuration Manual, 02/2018, C79000-G8976-C451-02
465
The percentage of the channel currently being used by Wi-Fi devices.
Type Device type.
The percentage of the channel currently being used by non-Wi-Fi devices.
Known APs Number of valid APs identified on the radio channel.
Number of invalid or rogue APs identified on the radio channel.
Percentage of the channel currently in use.
Max AP Signal (dBm) Signal strength of the AP that has the maximum signal strength on a chan-
Signal strength of the non-Wi-Fi device that has the highest signal strength.
SNIR (dB) The ratio of signal strength to the combined levels of interference and noise
on that channel. This value is calculated by determining the maximum
noise-floor and interference-signal levels, and then calculating how strong
the desired signal is above this maximum.
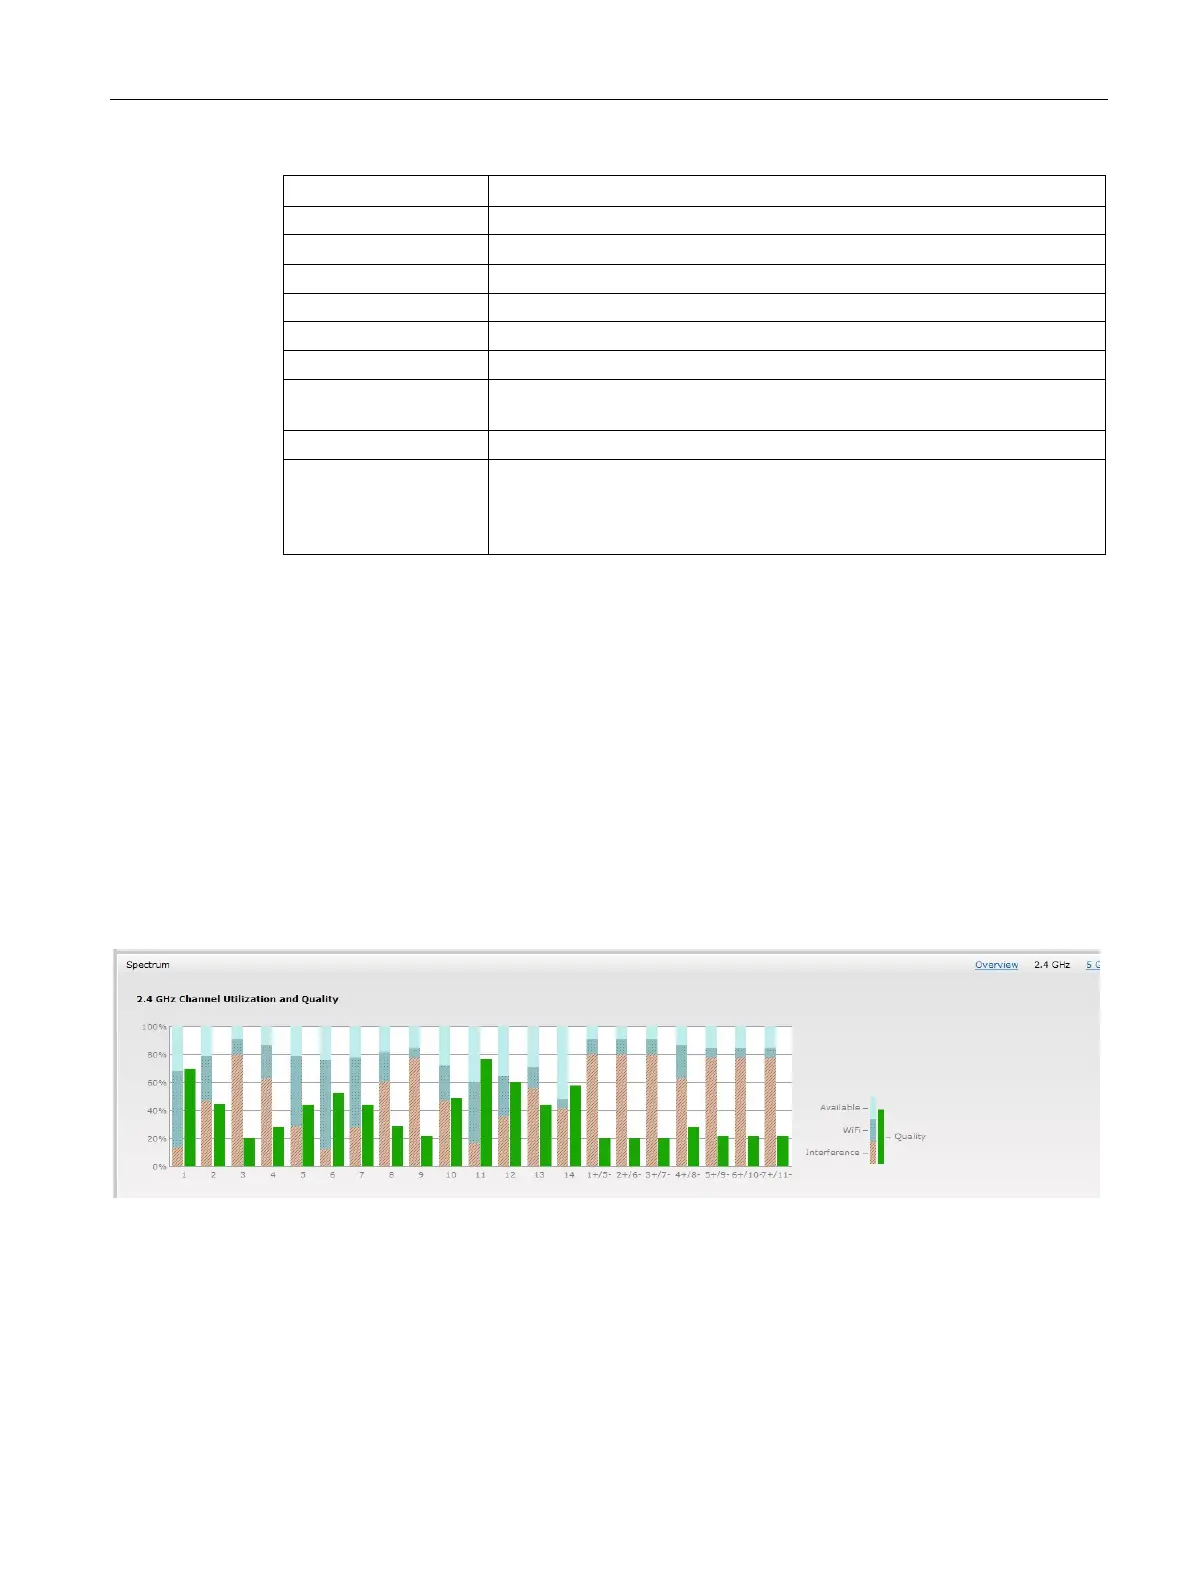
The channel metrics graph displays channel quality, availability, and utilization metrics as
seen by a spectrum monitor or hybrid AP. You can view the channel utilization data based
on 2 GHz and 5 GHz radio channels. The percentage of each channel that is currently being
used by Wi-Fi devices, and the percentage of each channel being used by non-Wi-Fi devices
and 802.11 adjacent channel interference (ACI). This chart shows the channel availability,
the percentage of each channel that is available for use, and the current relative quality of
selected channels in the 2.4 GHz or 5 GHz radio bands. While spectrum monitors can
display data for all channels in their selected band, hybrid APs display data for a single
monitored channel.
To view this graph, click
in the
section of the dashboard.
Figure 30-3 Channel Metrics for the 2.4 GHz Radio Channel
To view this graph, click
in the
section of the dashboard.
 Loading...