7.
Tap View results4Details.
8.
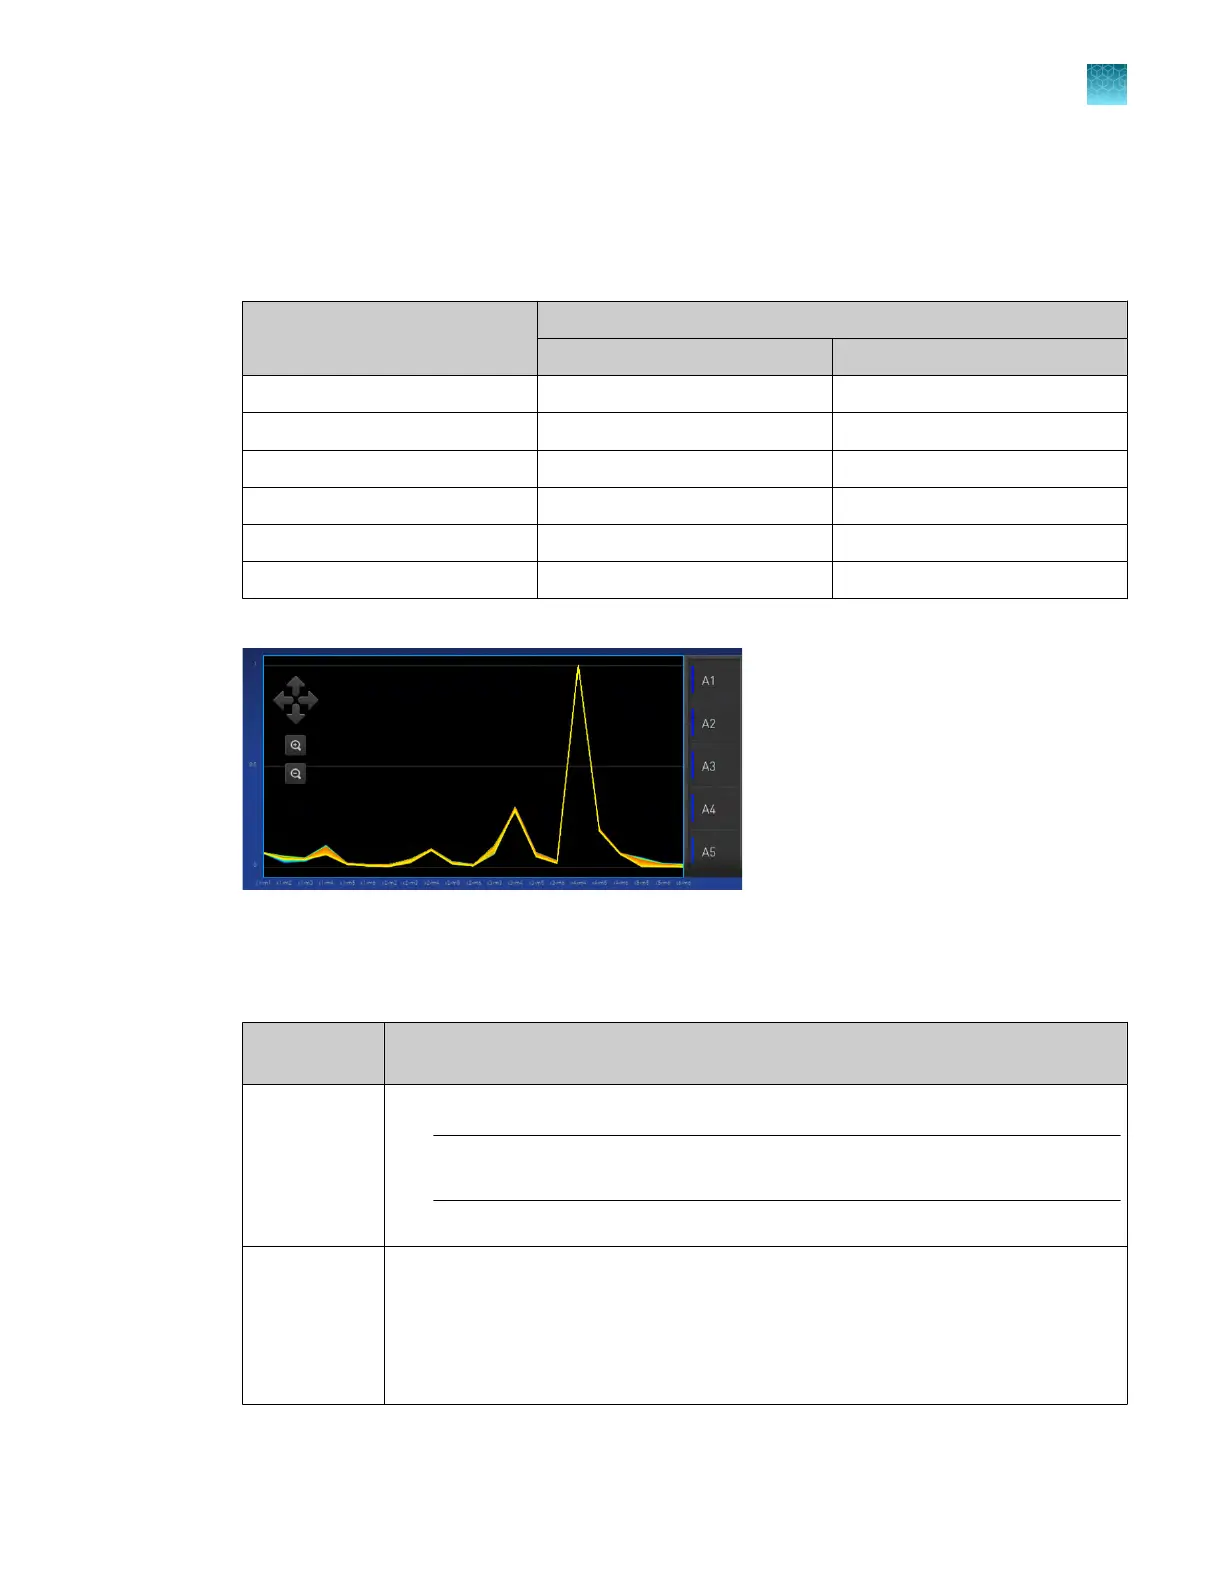
Review the plot.
Calibration results that pass show uniform signals with peaks that are aligned with the dye
wavelength.
Peak filt
er
Filter wavelength (nm)
[1]
Excitation Emission
x1-m1 470 ± 15 520 ± 15
x2-m2 520 ± 10 558 ± 11
x3-m3 550 ± 11 586 ± 10
x4-m4 580 ± 10 623 ± 14
x5-m5 640 ± 10 682 ± 14
x6-m6 662 ± 10 711 ± 12
[1]
T
he central wavelengths are the optimized wavelengths.
Figure 17 An example of a dye calibration plot
The peaks for your dye may align with a dier
ent filter set.
9.
Select an action depending on whether the custom dye calibration passed or failed.
Calibration
status
Action
Passed
1.
T
ap Accept Results or Reject Results.
Note: Accepting the results saves the calibration data to the instrument and
overwrites existing data.
2.
(Optional) T
ap Transfer to EDS to transfer the calibration data to a USB drive.
Failed
1.
Perform the calibration again using a new custom dye plate. Create the plate
using the next dye concentration greater than the optimal dye concentration (see
“Determine the optimal dye concentration” on page 116).
2.
For more information about calibration failures, see “Troubleshoot calibration
failure” on page 95.
Chapter 7 Calibrate and verify instrument performance
Calibrate custom dyes
7
QuantStudio
™
6 Pro Real-Time PCR System and QuantStudio
™
7 Pro Real-Time PCR System User Guide
119