17-13
IM DL950-02EN
Configuring the Harmonic Analysis Window (Harmonic Window
Setup)
Setting the Display Type (Type)
3.
Tap Window Setting, or press the soft key.
4.
Tap Type, or press the soft key.
From the menu that appears, select the display type.
Set Type (Bar Graph, List, Vector).
Set Display to ON.
There are three methods to display the harmonic analysis results.
• Bar graph (Bar): A bar graph is displayed for the calculated harmonic value of each
harmonic up to the 40th harmonic.
• List (List): A numerical list is displayed for the calculated harmonic value of each harmonic
up to the 40th harmonic.
• Vector (Vector): The relationship of the phase difference and size (rms value) between the
fundamental waves U(1) and I(1) of the element is displayed with vectors.
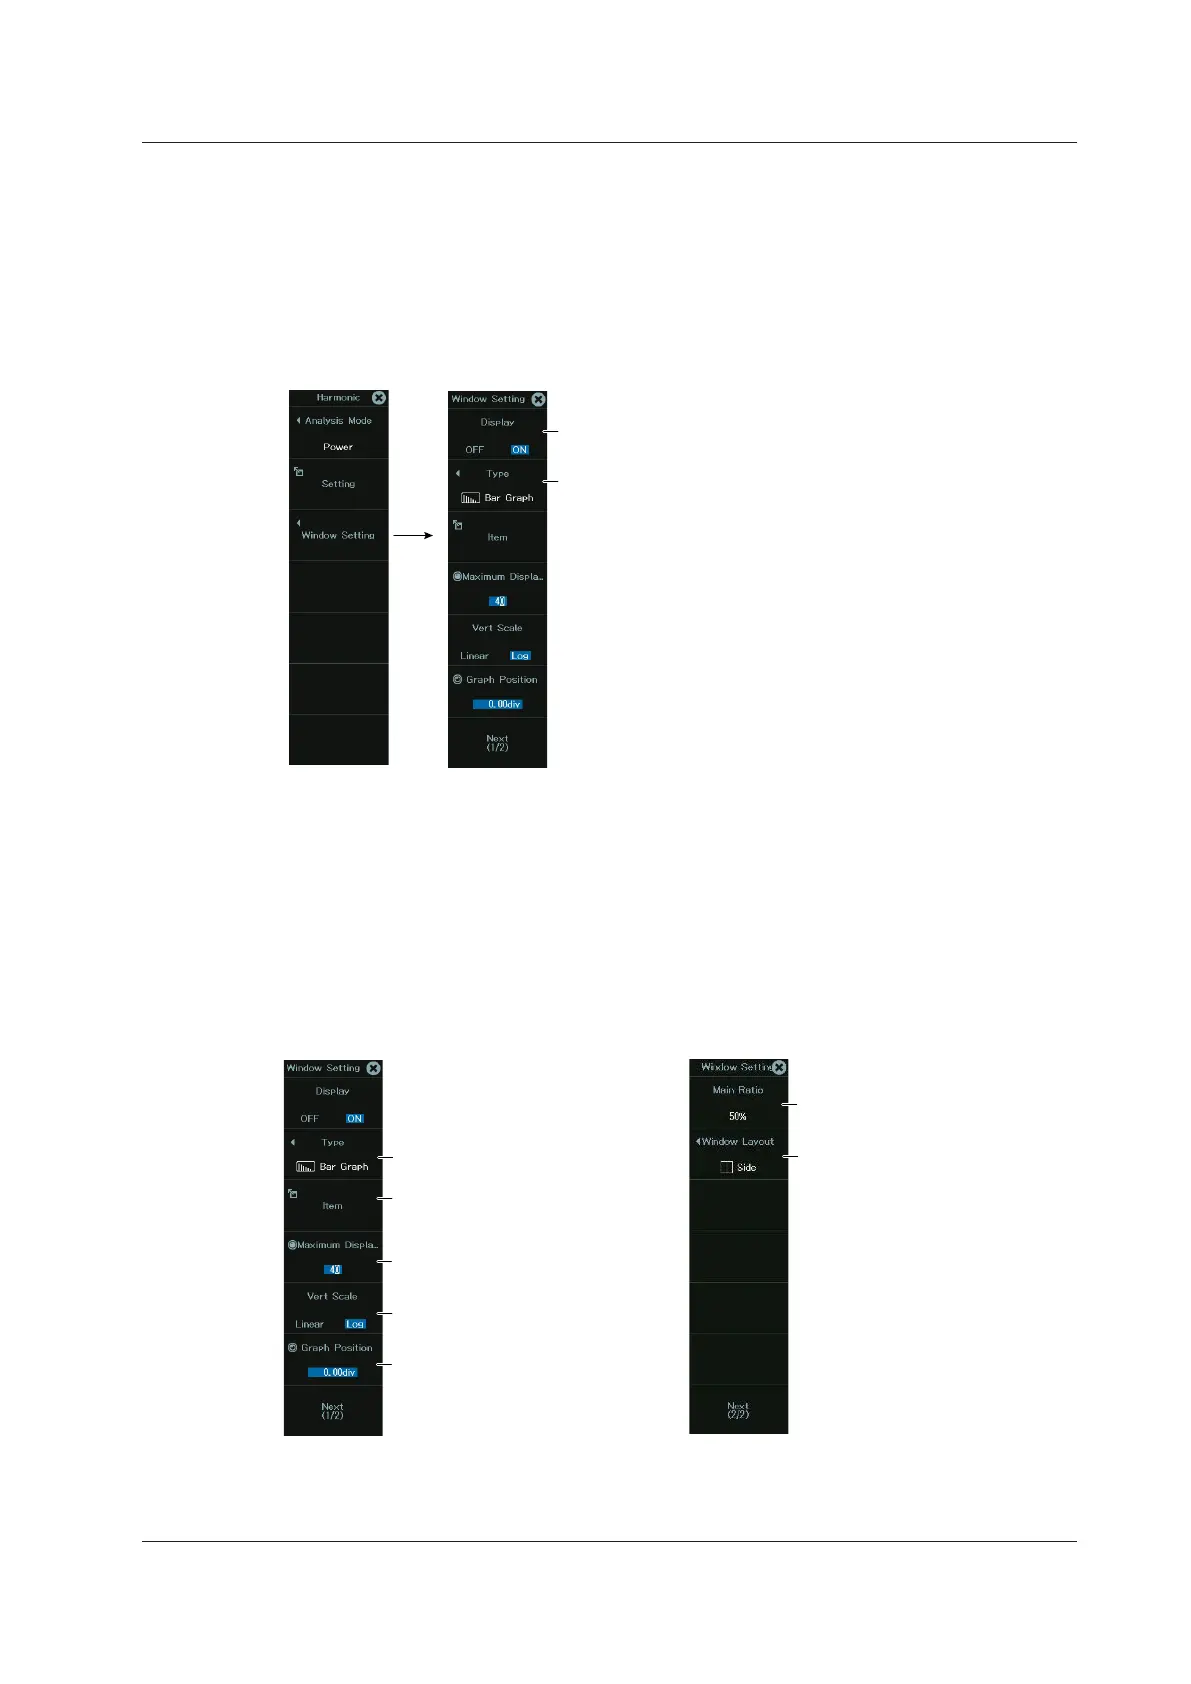
Configuring the Bar Graph (Bar Graph)
Graph position
Set the maximum displayed
harmonic.
Select Bar Graph.
Set the displayed items (RMS,¹
P,² Hdf, φ ON/OFF).
Set the vertical scale
(Linear, Log).
Set the main screen ratio
(50%, 20%, 0%).
Set the window layout
(Side, Vertical).
Window setup menu (1/2)
Window setup menu (2/2)
1: When the analysis mode is Line RMS
2: When the Analysis Mode is Power
17.2 Harmonic Analysis (Harmonics)
 Loading...