NanoSuite 4
Agilent Nano Indenter G200 User’s Guide 4-78
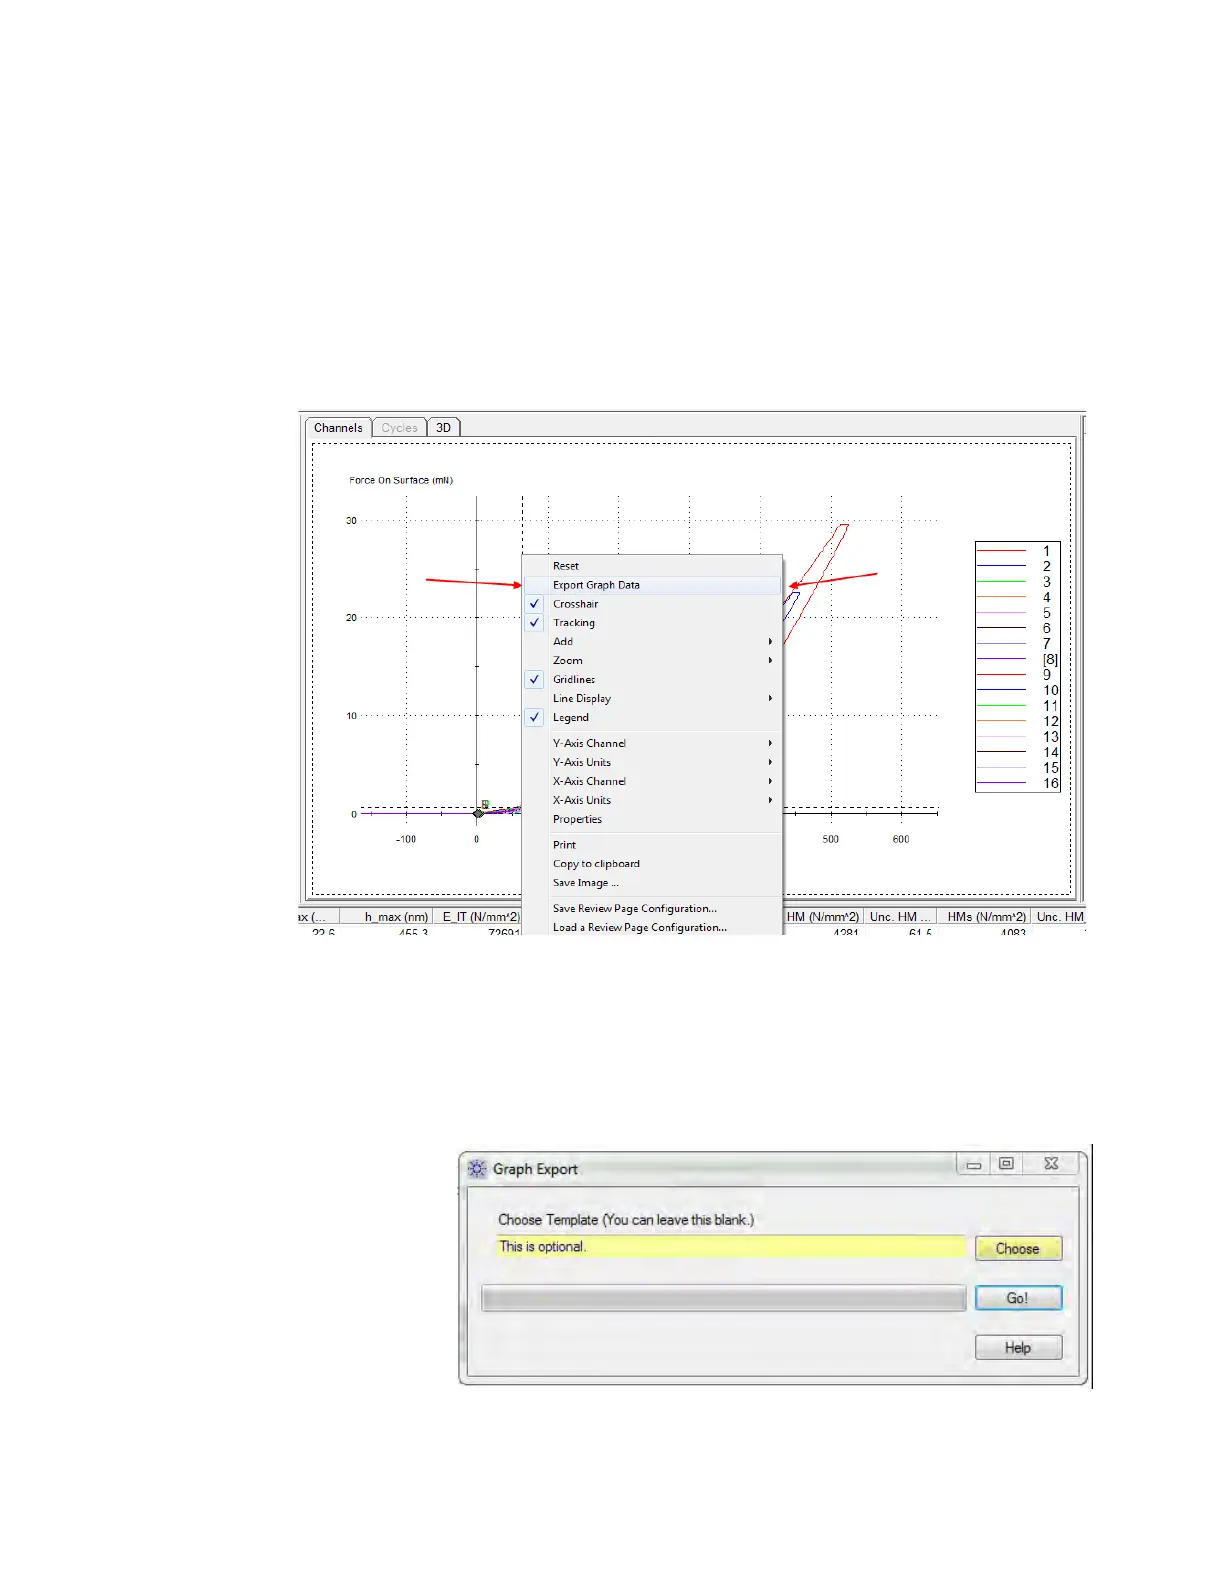
This command enables you to export graph data to Microsoft Excel.
1 Select the desired tests and channels with the desired units on the
Review Graph panel.
2 Once the graph displays the data that you are interested in exporting,
right-click with the mouse and select Export Graph Data from the
resulting pop-up menu (see
Figure 4-81).
Figure 4-81Export Graph Data from right-click menu
3 The Graph Export dialog box will be displayed as shown in
Figure 4-82.
Figure 4-82Graph Export dialog box
 Loading...