NanoSuite 4
Agilent Nano Indenter G200 User’s Guide 4-80
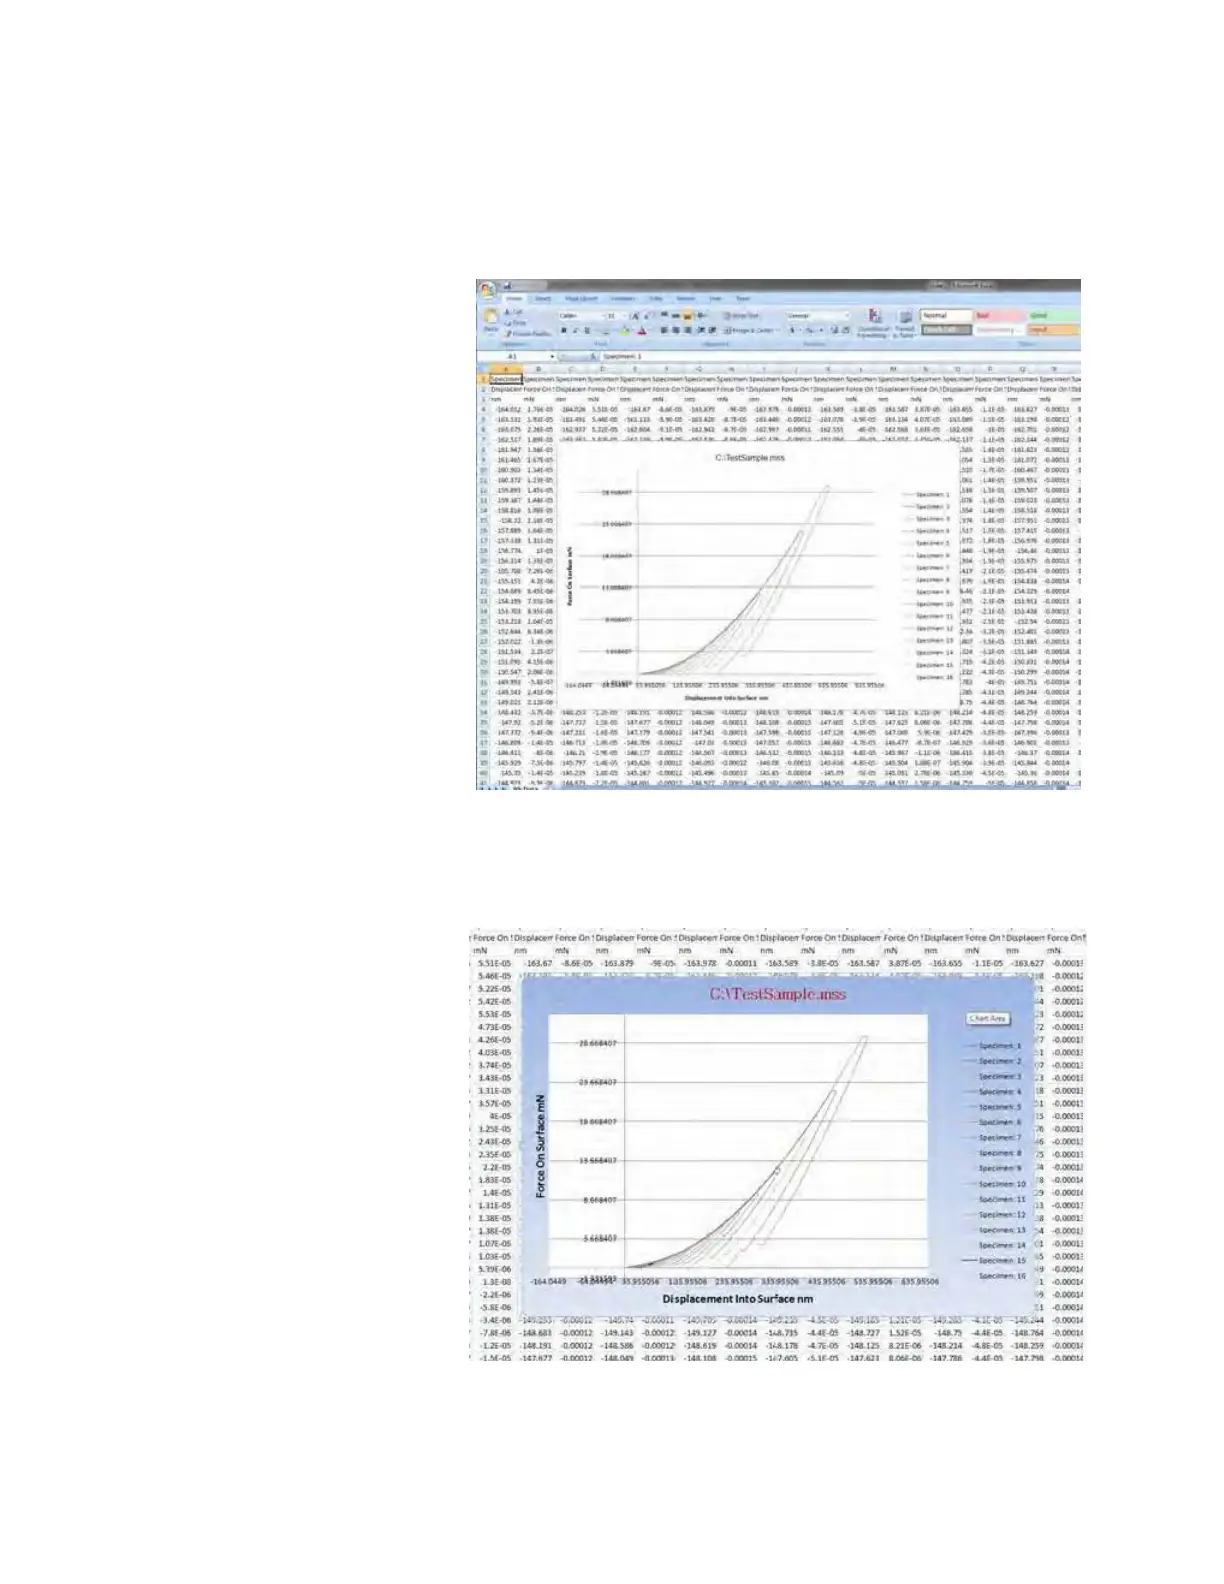
A graph will open in Excel showing the filtered data. An example of a
graph with default settings is shown in
Figure 4-84.
Figure 4-84Excel data and graph using default settings
A graph generated using a template is shown in Figure 4-85.
Figure 4-85Excel data and graph using a template
 Loading...