NanoSuite 4
Agilent Nano Indenter G200 User’s Guide 4-98
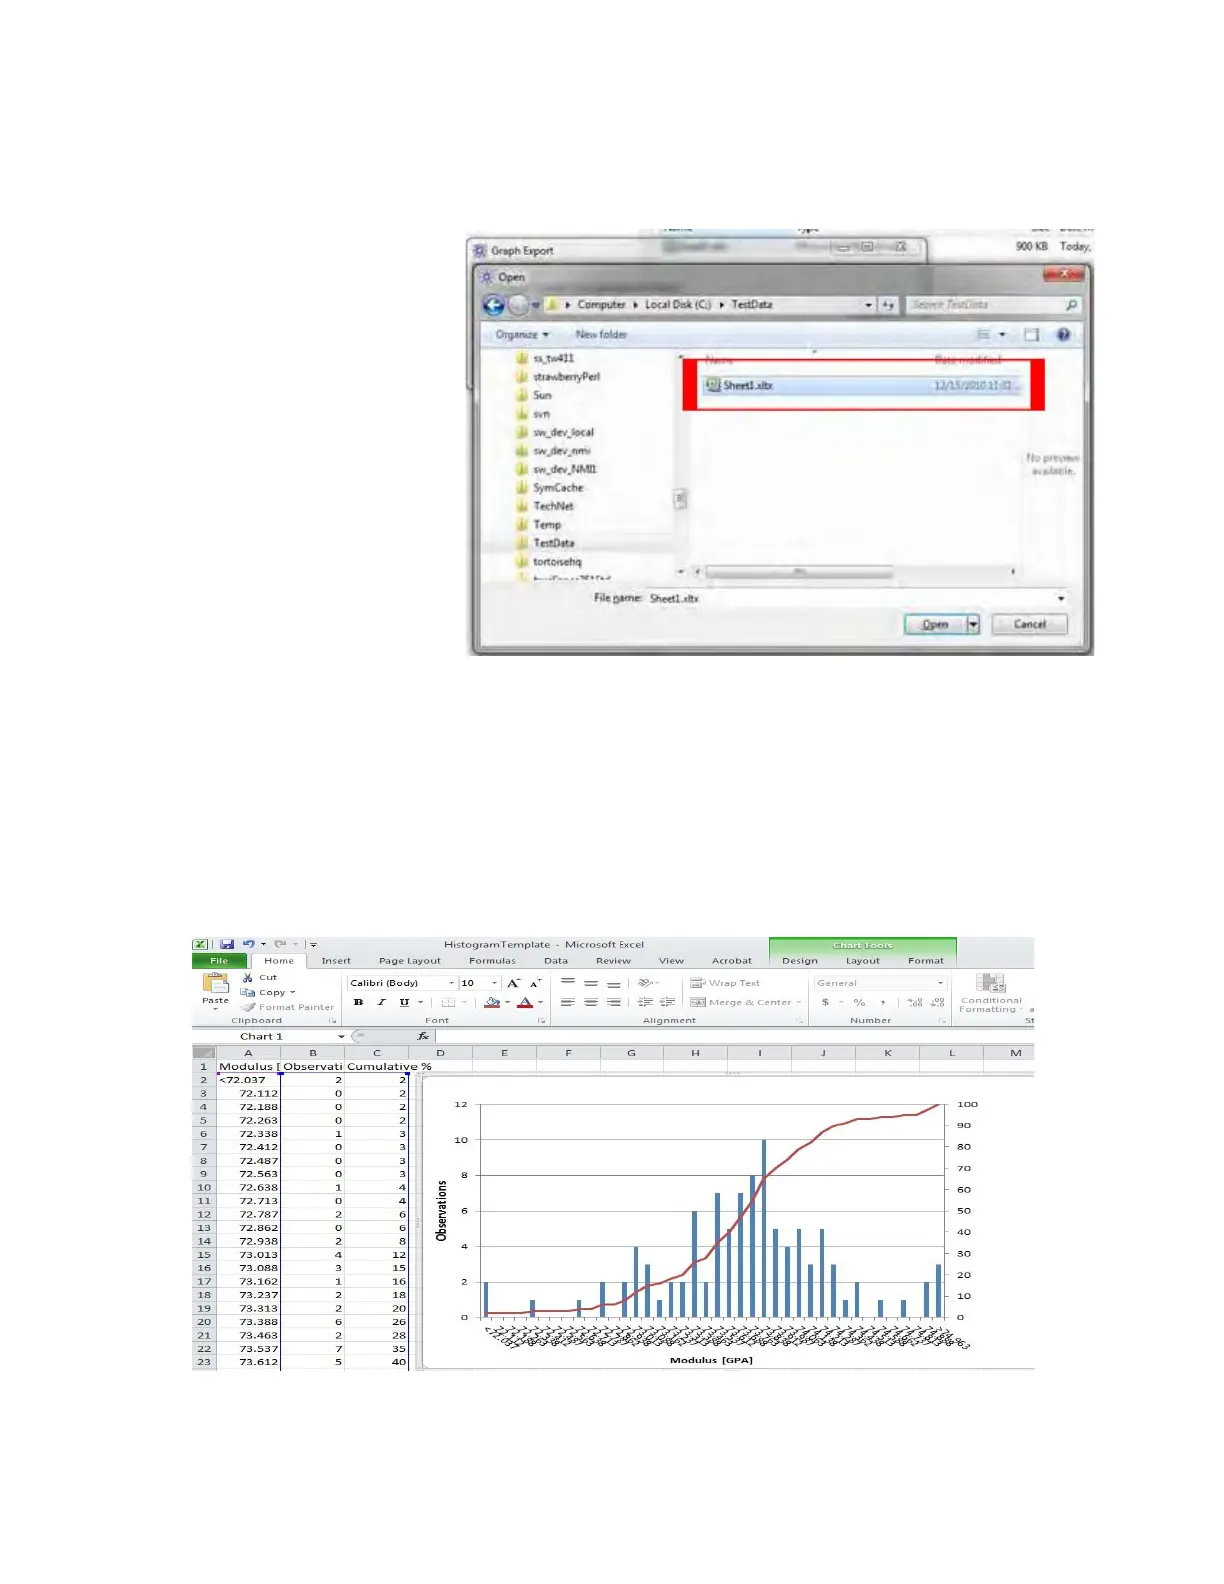
4 (optional) Select a Excel template as shown in Figure 4-105.
Figure 4-105Select a template
After either leaving the template path blank for default chart or choosing
an Excel template to use:
5 Click Go from the Graph Export dialog box.
A graph will open in Excel showing the filtered data. An example of a
graph with default settings is shown in
Figure 4-106.
Figure 4-106Excel data and graph using default settings
 Loading...