User's Manual 442 Document #: LTRT-68822
Mediant 2000
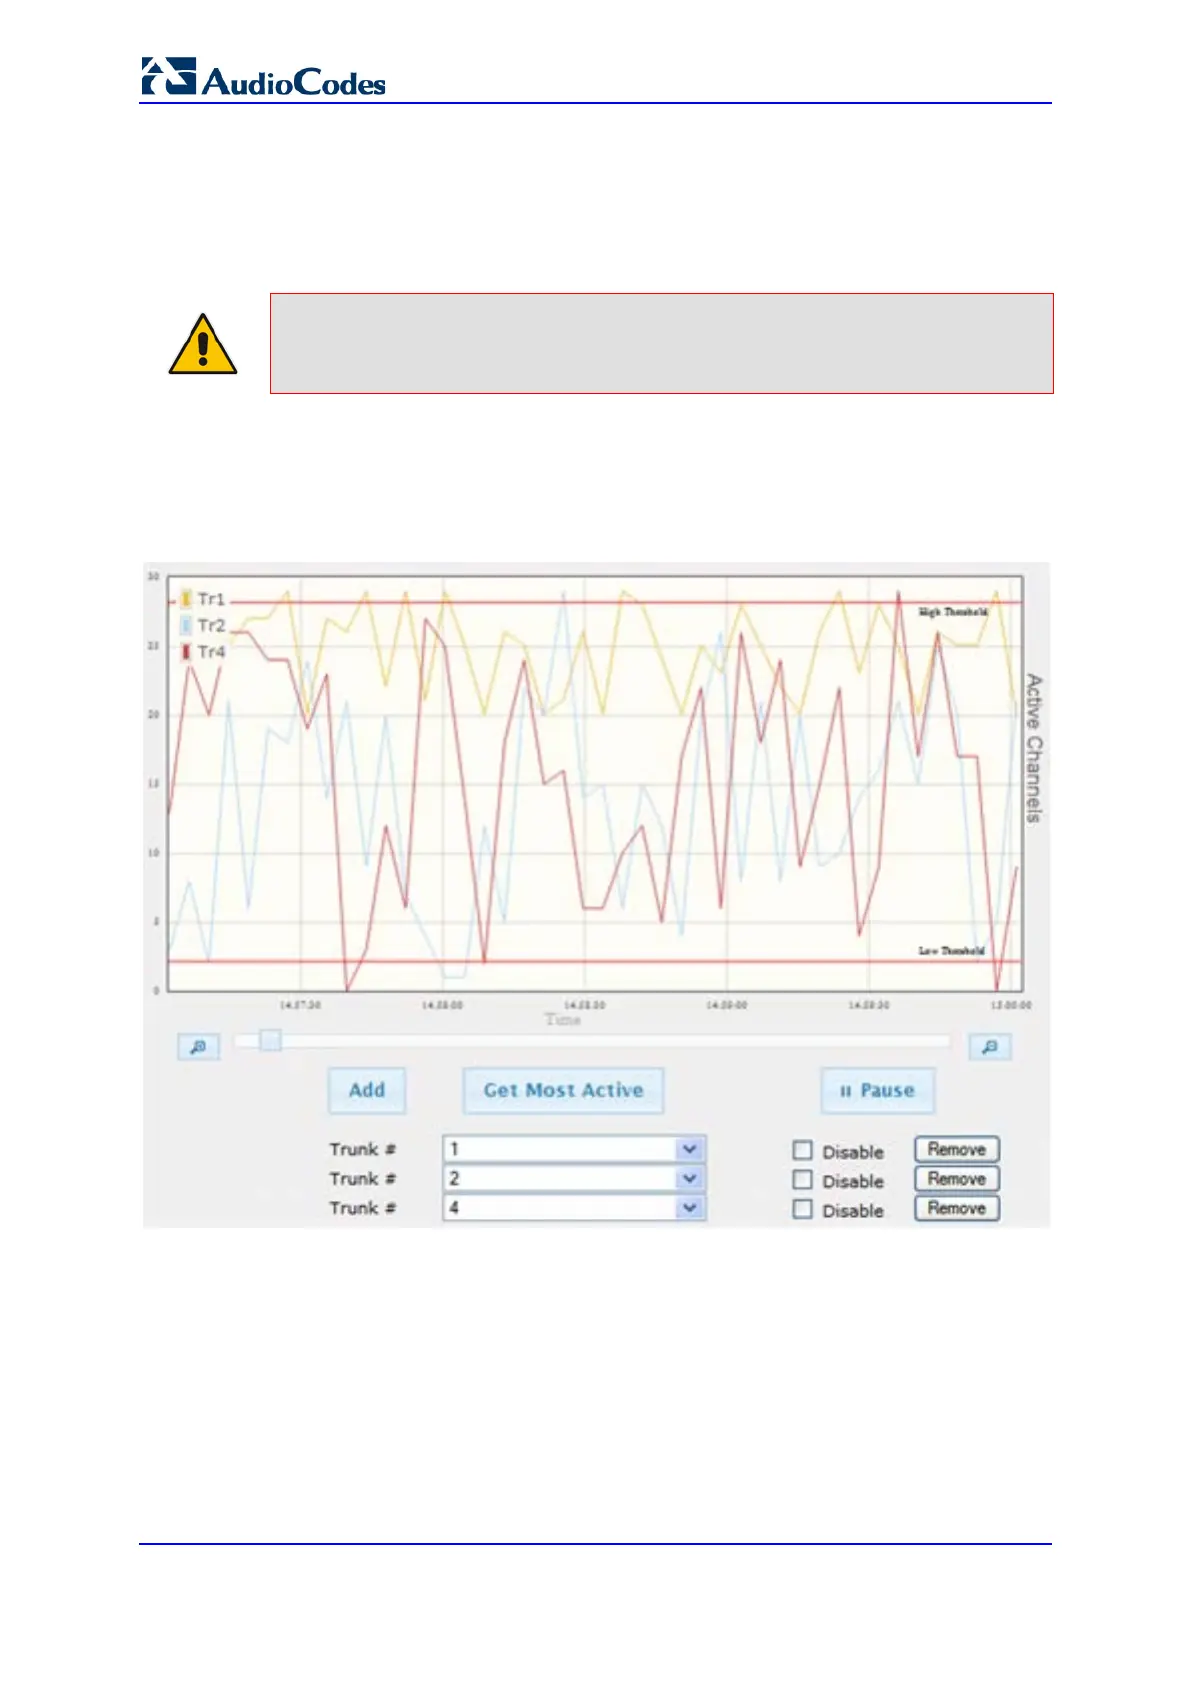
38.2 Viewing Trunk Utilization
The Trunk Utilization page provides an X-Y graph that displays the number of active
channels per trunk over time. The x-axis indicates the time; the y-axis indicates the number
of active trunk channels.
Note: If you navigate to a different page, the data displayed in the graph and all its
settings are cleared.
To view the number of active trunk channels
1. Open the Trunk Utilization page (Status & Diagnostics tab > Performance
Monitoring menu > Trunk Utilization).
Figure 38-2: Trunk Utilization Page
2. From the 'Trunk' drop-down list, select the trunk for which you want to view active
channels.