254
────────────────────────────────────────────────────
13.4 Output Waveform
────────────────────────────────────────────────────
NOTE
Regeneratio
Consumptio
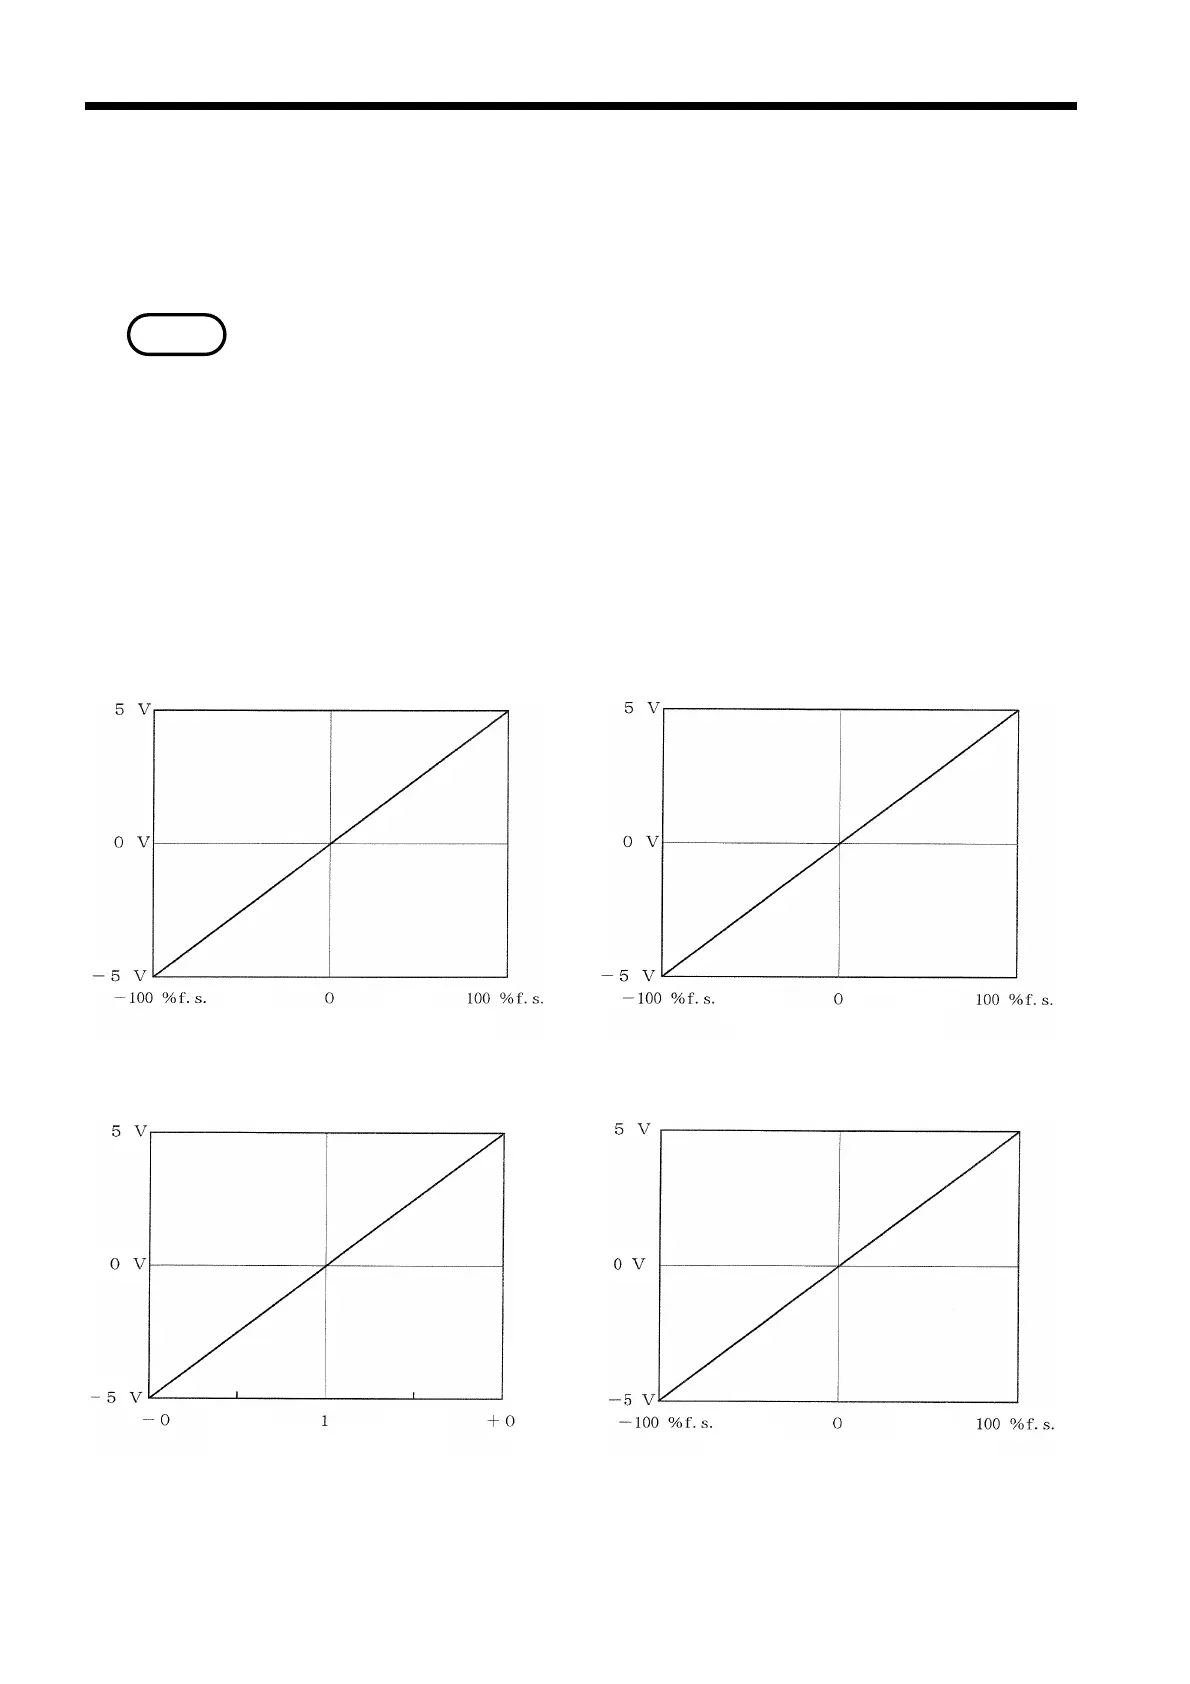
D/A Output for Apparent Power
Lea
La
D/A Output for Reactive Power
Lea
Lag
D/A Output for Power Factor
Consumptio
D/A Output for Phase Angle
3.4 Output Waveform
Because the output waveform format differs according to the D/A output item,
refer to the examples shown below.
・If the reactive power meter method is used, only positive data is output for
the apparent power.
・In the case of an plus over-range signal to the positive side, approximately 6.6
V is output, for minus over-range, approximately - 6.6 V is output.
・When the display is being held, the data that is being held is output in
Integrated Measurement or Demand Measurement mode.
・In the Normal Measurement mode, outputs are updated irrespective of the
hold status of the display.
・If the power integration increases uniformly, once it reaches the full-scale
setting the output voltage returns 0 V once and then increases again. (The
level is recorded as a sawtooth wave.)