260
────────────────────────────────────────────────────
14.2 Type and Amount of Data That Can Be Saved
────────────────────────────────────────────────────
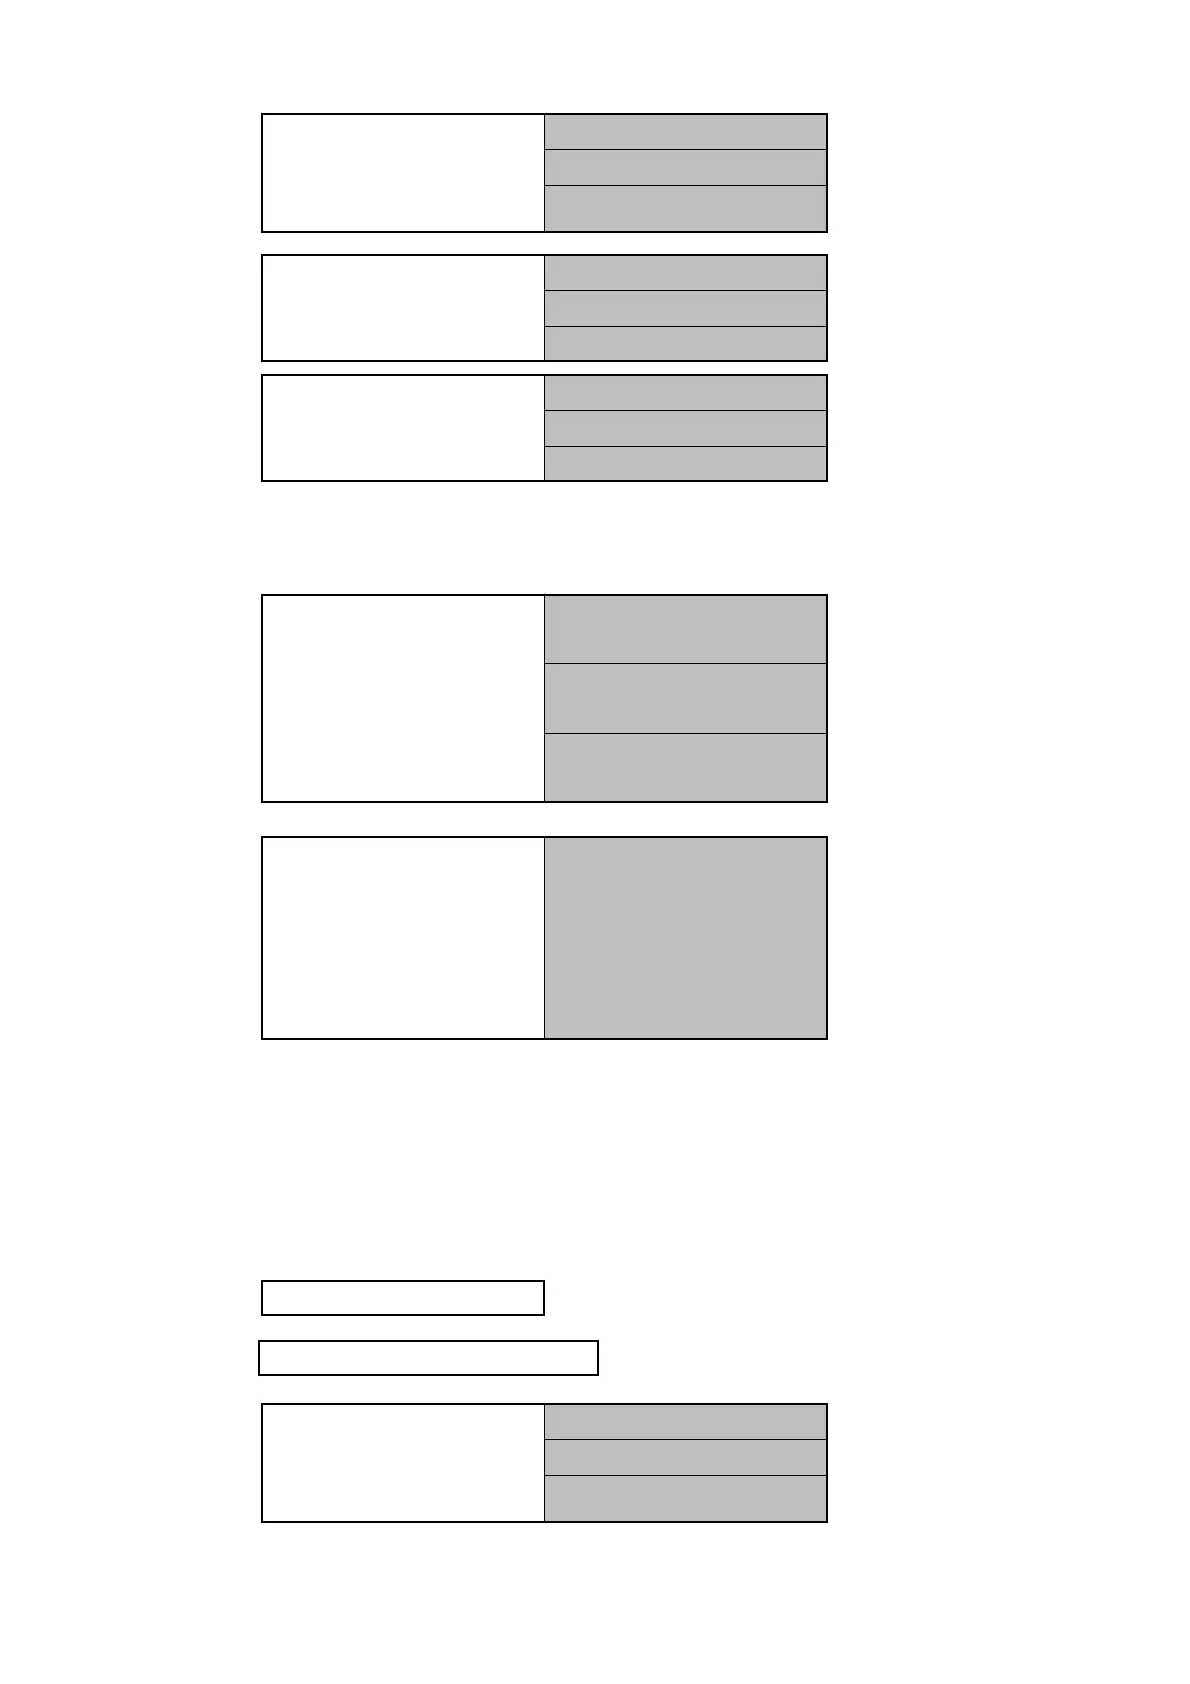
3.Instantaneous values
Instantaneous value dat
at the time of output to th
floppy disk
Voltage(U1, U2, U3, Uave
Current(I1, I2, I3, Iave)
Power(P, Q, S, λ, f)
4. Maximum values
Voltage(U1, U2, U3)
Current(I1, I2, I3)
Power(P, Q, S, λ, f)
5. Minimum values
Voltage(U1, U2, U3)
Current(I1, I2, I3)
Power(P, Q, S, λ, f)
6.Power integration
Active power
(+WP, −WP, ΣWP)
Reactive power
(+WQ, −WQ, ΣWQ)
Apparent power
(+WS, −WS, ΣWS)
7.Average value within
a time period
Integrated average
values within a time
period, based on the
power integration
Power(P, Q, S, λ)
1.FD output date and time
2.Demand measurement start tim
3.Instantaneous values
Instantaneous value dat
at the time of output to th
floppy disk
Voltage(U1, U2, U3, Uave
Current(I1, I2, I3, Iave)
Power(P, Q, S, λ, f)
* The minimum/maximum data includes the time at which the minimum or
maximum was generated.
* Items 4 through 7 represent data that was tabulated until the FD output
time from the integrated measurement start time.
● Demand Measurement mode
The following data from demand measurement, integrated measurement, daily
reports, weekly reports, and monthly reports can be saved.