77
────────────────────────────────────────────────────
6.4 Taking Measurements
────────────────────────────────────────────────────
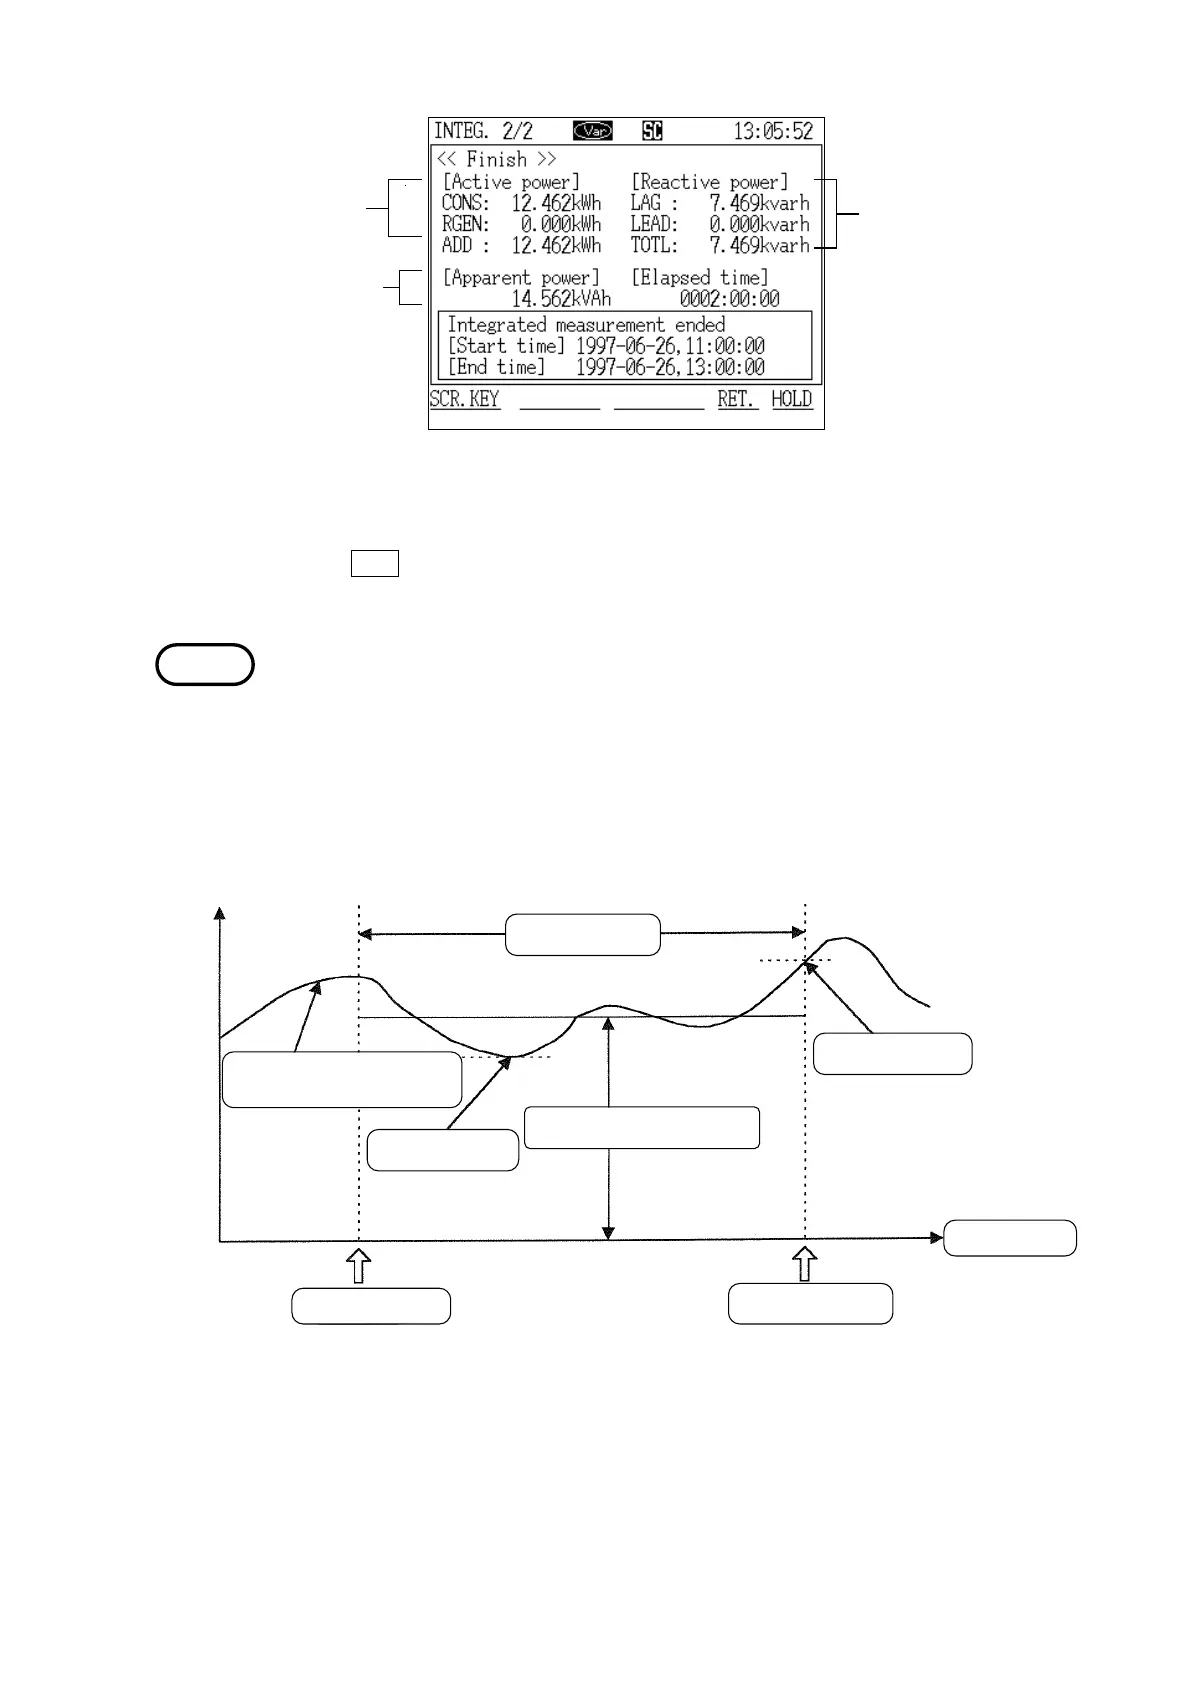
pparent power integratio
Reactive power
Integration
(lag,lead,total)
Active power integratio
(consumption,
regeneration,
addition)
Integration Screen (page 2/2)
(When using the reactive power meter method)
NOTE
Elapsed tim
Instantaneous valu
Change in instantaneou
value
Integration tim
Minimum valu
Average value over tim
Maximum value
Integration star
Integration stop
Display Values for Integrated Measurement
If the
RET. function key is pressed after the data has been cleared, a "Initial"
screen is displayed.
The relationship between minimum/maximum values and the average value is
shown in the figure. In the case of interval output, the average value is
obtained from values from the integration start to the interval output. The
minimum and maximum values are also obtained from values from the
integration start to the interval output. However, if a data reset was not
performed before the start of integration, the displayed data will include the
data from the previous integration operation.
Reference The procedures for printing the measured values on a printer or for saving
them on floppy disk are the same as in "Normal Measurement" mode. Refer
to section 5.4.3, "Printing Measured Values on the Printer," and section 5.4.4,
"Saving Measured Values on Floppy Disk."