190
Cha
ter 7
Calculation
Anal
sis
and Out
ut of Ins
ection Results
7.4.3 Statistics Items
A list of statistics items
No. Item Content Tar g e t Da t a Display
Reference to
Data Monitor
1 Scan Number Inspection execution count -
2 OK Count The number of OK judgment
results
Judgment, Numeric
Calculation
3 NG Count The number of NG judgment
results
Judgment, Numeric
Calculation
4 OK Average Average value for “OK Count” Numeric Calculation
5 Disperse OK
*1
Disperse value for “OK Count” Numeric Calculation
6 Max. Max. Value after starting count. Numeric Calculation
7 Min. Min. value after starting count. Numeric Calculation
8 Range Difference between No. 6 (Max.
value) and No.7 (Mix. value)
Numeric Calculation
Can be
displayed in
the Statistics
table.
OK
*1
Disperse value is calculated according to the following formula;
Disperse formula =
n/)))XaverageXn()XaverageXn(((
−Σ
Disperse values are displayed and output by multiplying 100.
n = the number of OK counts
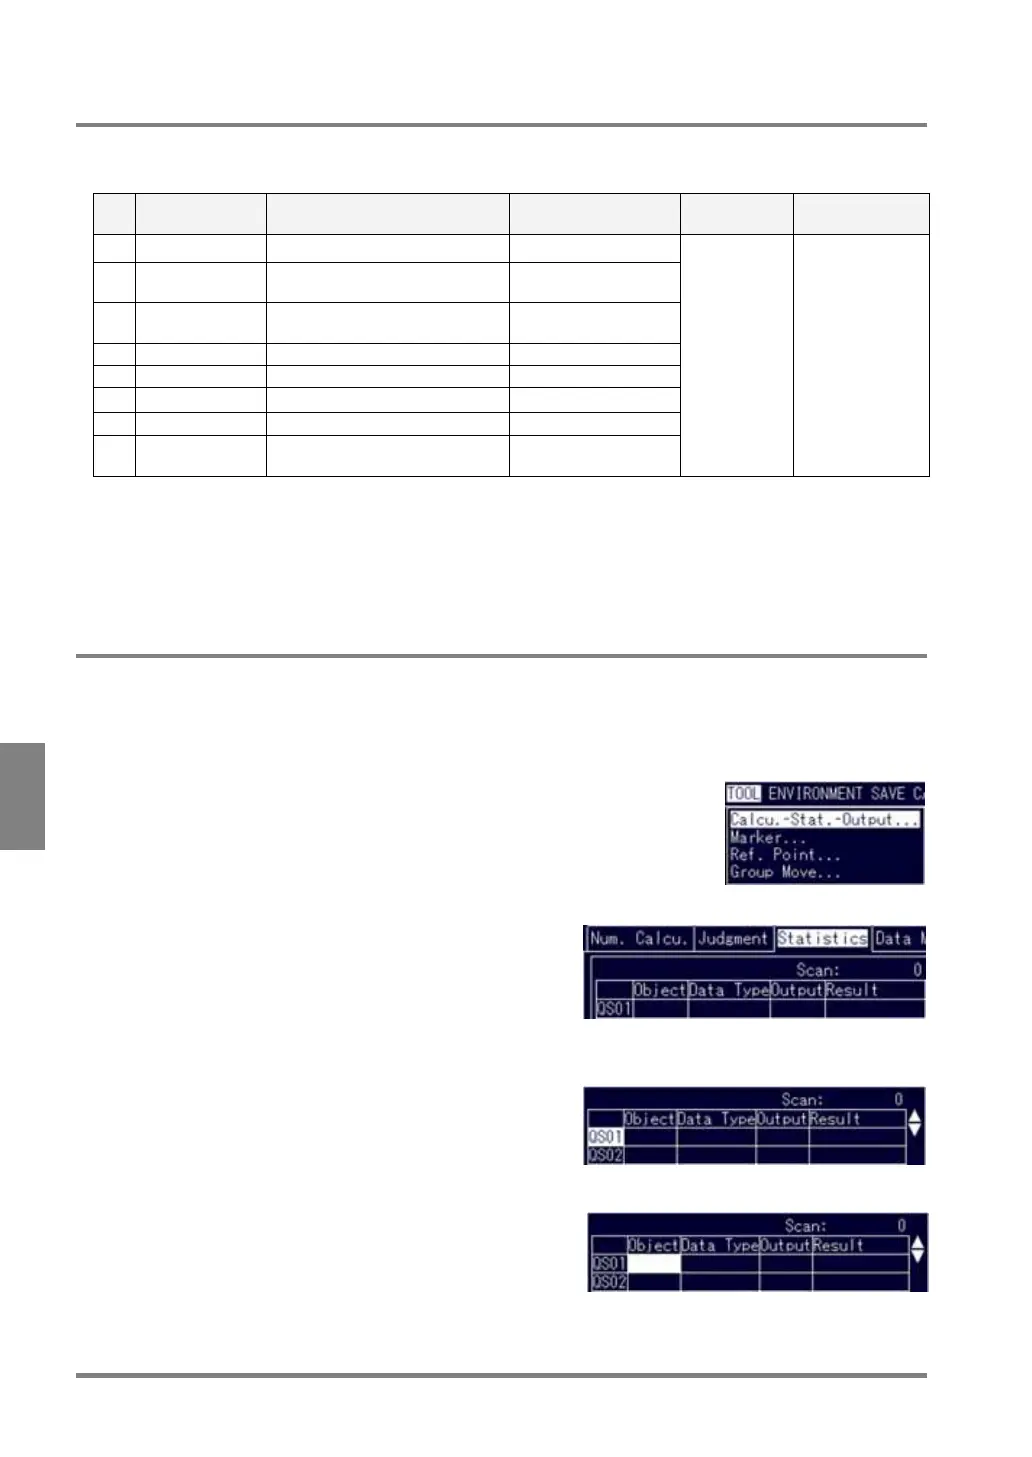
7.4.4 Referring Statistic Object Data
An example way of referring the numeric calculation No.1 to Statistics No.1 (QS01) is as follows:
1. Select "TOOL" > "Calcu.-Stat.-Output" from the menu bar.
The subwindow is displayed.
2. Select the Statistics tab.
3. Select "QS01".
The cursor moves to the “QS01” cell in the Object column.
4. Check to make sure that the cell is highlighted and press the ENTER key.
The subwindow is displayed.