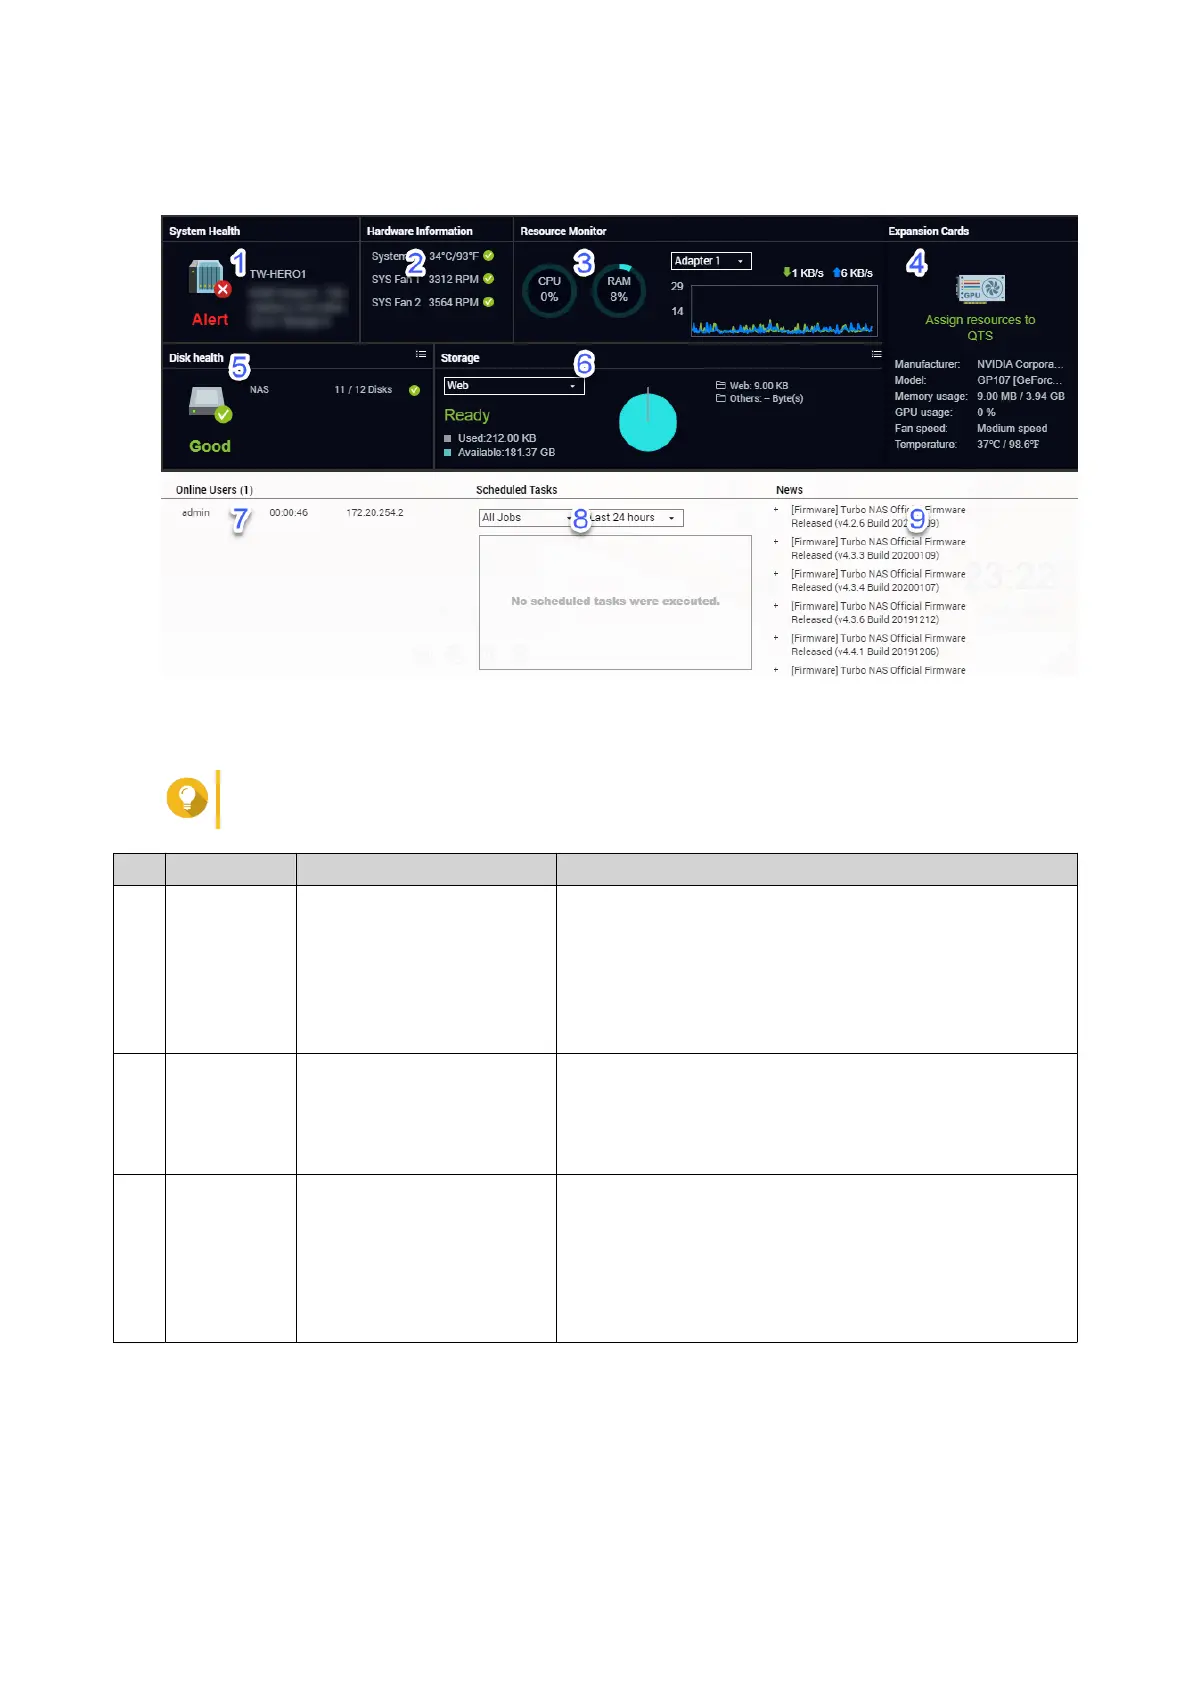
Dashboard
The dashboard opens in the lower right corner of the desktop.
Tip
You can click and drag a section onto any area of the desktop.
No. Section Displayed Information User Actions
1 System
Health
• NAS name
• Uptime (number of
days, hours, minutes
and seconds)
• Health status
Click the heading to open Control Panel > System >
System Status > System Information .
If disk-related issues occur, click the heading to open
Storage & Snapshots.
2 Hardware
Information
• System temperature
• CPU fan speed
• System fan speed
Click the heading to open Control Panel > System >
System Status > Hardware Information .
3 Resource
Monitor
• CPU usage in %
• Memory usage in %
• Network upload and
download speeds for
each adapter.
Click the heading to open Control Panel > System >
Resource Monitor > Overview .
QTS 4.5.x User Guide
Overview 23
 Loading...