10-28
IM DLM6054-01EN
10.6 Displaying Histograms, Trends, and Lists
of Automated Measurements of Waveform
Parameters
Procedure
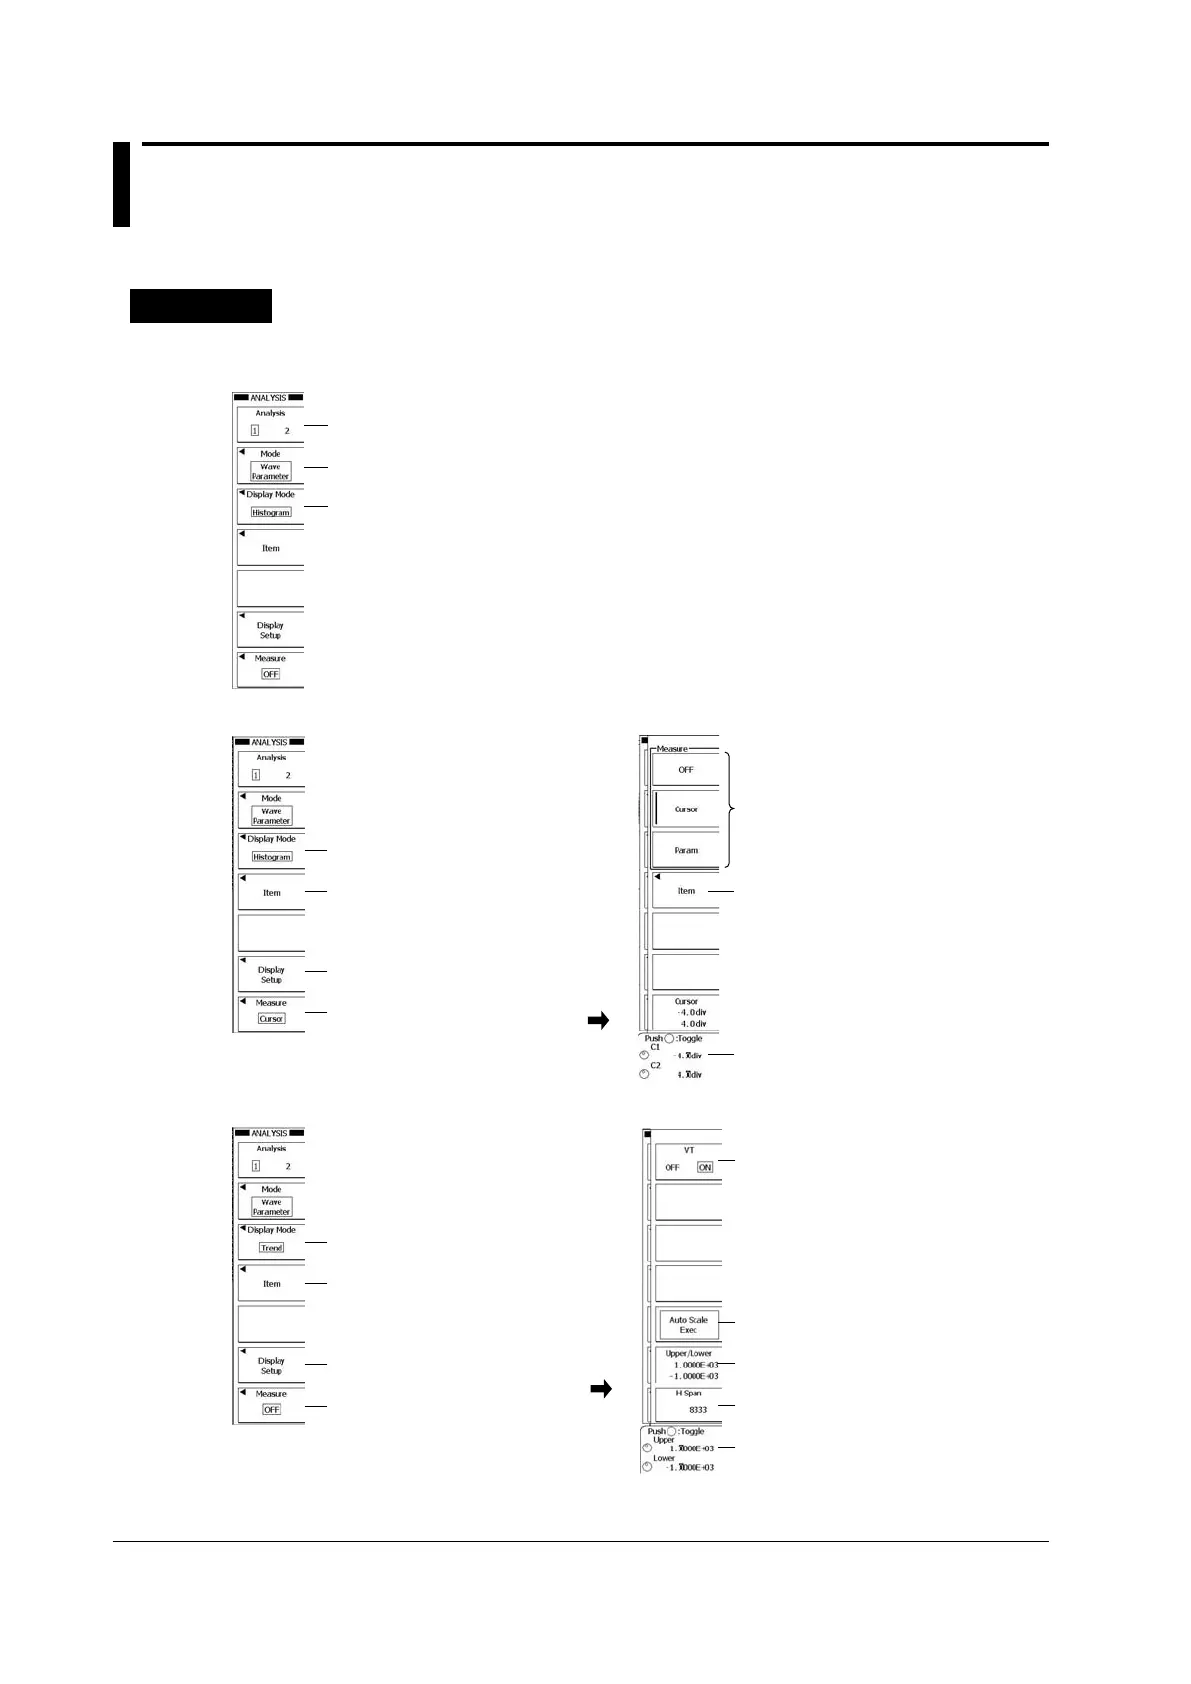
ANALYSIS Wave Parameter Menu
Press ANALYSIS to display the following menu.
Set the analysis number (1, 2).
Set the analysis type to waveform parameter.
Set the display mode (Histogram, Trend, List).
Configuring the Histogram Display (Histogram)
Set the display mode to Histogram.
Press to set the measurement item
to display a histogram for.
Press to turn the VT waveform
display on or off.
Set the analysis feature
(OFF, Cursor, Param).
Press to set the item to analyze.
Set the C1 and C2 cursor positions
(only when Measure is set to Cursor).
Select an analysis option.
Configuring the Trend Display (Trend)
Set the display mode to Trend.
Press to set the measurement item
whose trend you want to display.
Press to turn the VT waveform
display on or off and to configure
the display range.
Set the analysis feature
(OFF, Cursor).
► figure shown above.
Executes auto scaling.
Set the vertical-axis scale value
manually.
Set the horizontal-axis scale value
manually.*
Press to turn the VT waveform display
on or off.
Set the vertical-axis (Upper/Lower) and
horizontal-axis (H-Span) scale values.
* When Mode in the MEASURE menu is set to Cycle
Statistics, set H Range (Main, Zoom1, Zoom2).
 Loading...