App-1
IM DLM6054-01EN
Appendix
3
2
1
4
5
6
7
8
9
10
11
12
13
14
15
16
17
18
Index
App
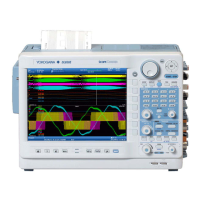
Appendix 1 How Waveform Areas Are Calculated
IntegTY
Sum of the positive and negative curve areas: S
1
+ S
3
– S
2
S
1
S
3
S
2
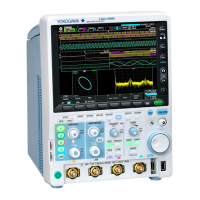
IntegXY for XY Display
Open
(1) When Each Y Data Point Corresponds to a Single X Data Point
1 3
Start
point
End
point
S
0
Area S = S
0
X-Axis (Y = 0)
X-Axis (Y = 0)
Area S = –S
0
End
point
Start
point
S
0
2 4
End
point
Start
point
S
0
Area S = S
0
– S
1
X-Axis (Y = 0)
X-Axis (Y = 0)
Area S = S
0
Start
point
End
point
S
0
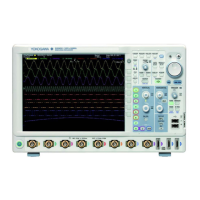
(2) When the Waveform Extends into the Negative Side
X-Axis (Y = 0)
S
0
S
1
Start
point
End point
(3) When There Are Multiple Y Data Points That Correspond to an X Data Point
X-Axis (Y = 0)
S
0
Start
point
End point
Area S = S
0
X-Axis (Y = 0)
S
0
End
point
Start
point
Area S = S
0
+ 2 × S
1
+ S
2
S
1
S
2
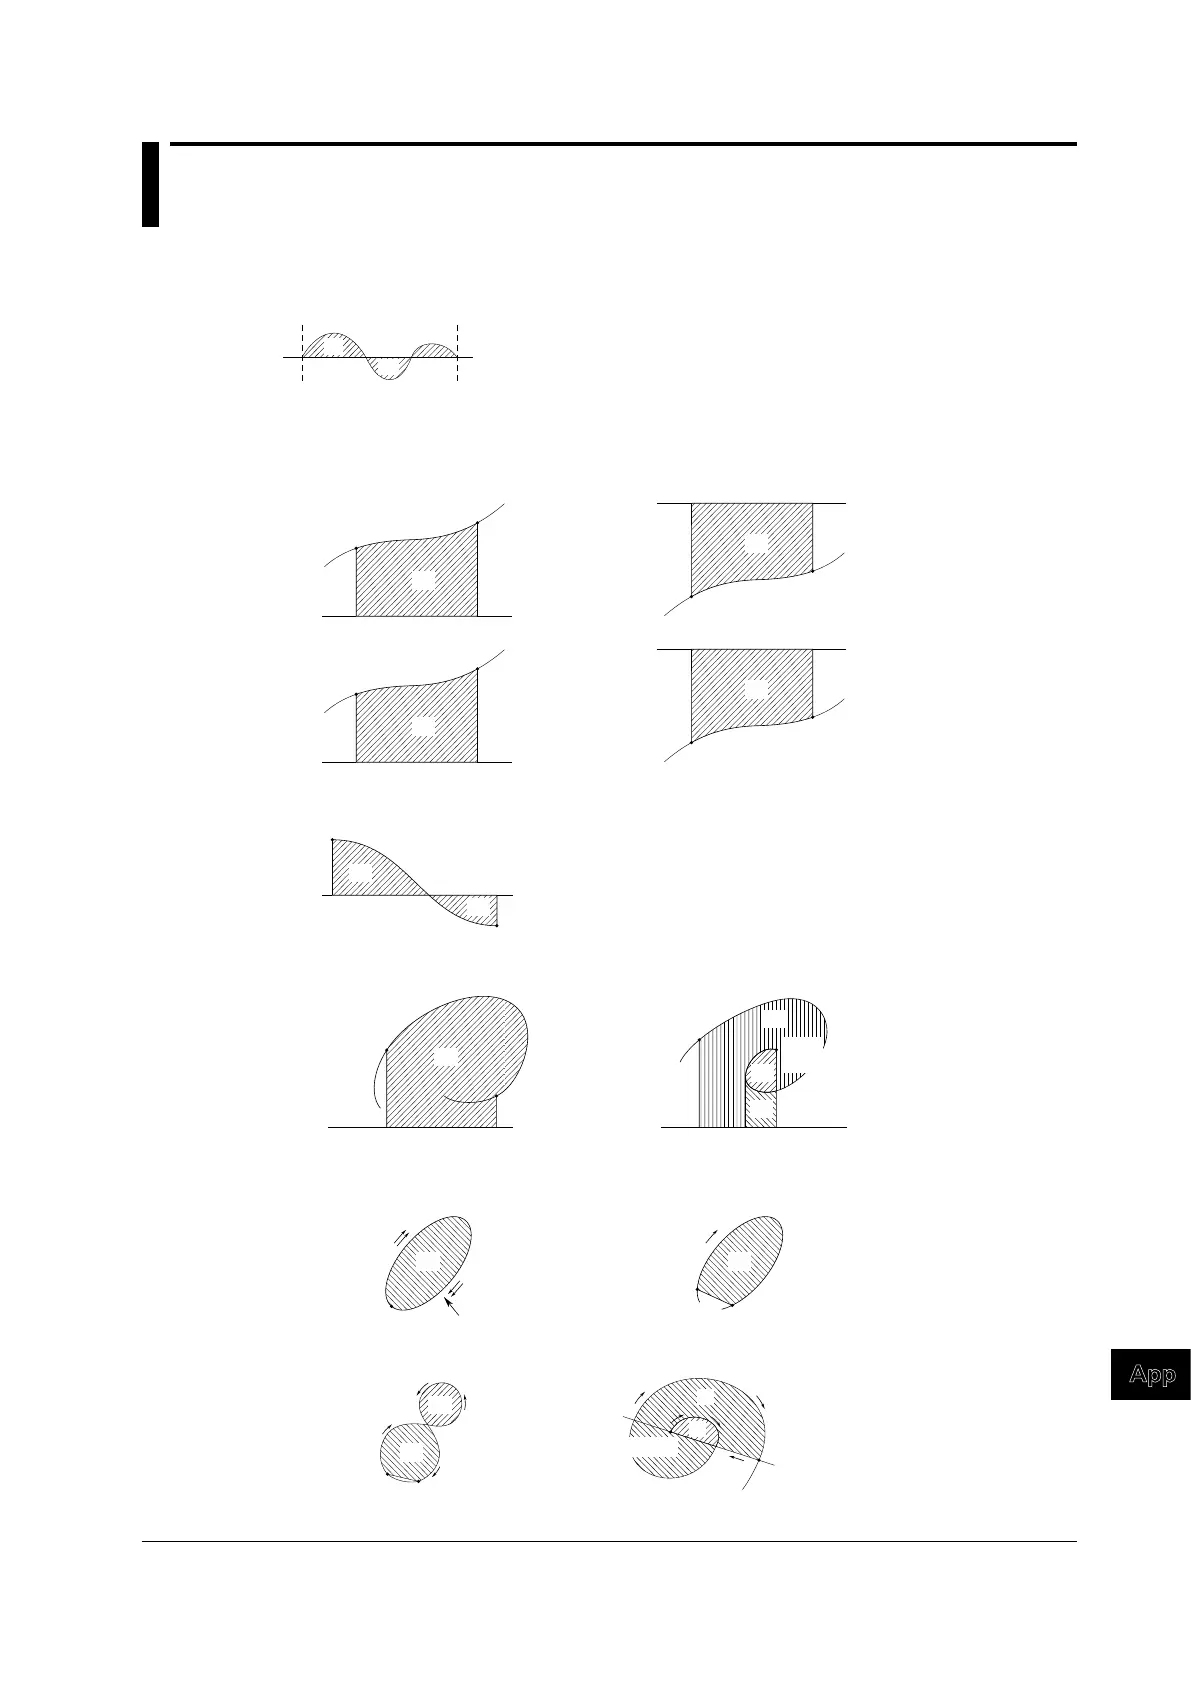
Area S = –S
0
Close
S
0
Start point,
end point
Area S = n × S
0
n: The number
of loops
S
0
Start point
Area S = S
0
Area enclosed by a
curve connecting the
start and stop points
End point
(3) Loop Tracing a Figure-Eight
Area S = |S
0
– S
1
|
(4) Loop Tracing a Spiral
Area S = S
0
× 2 + S
1
The number of overlaps
varies according to the
number of loops.
End point
S
0
S
1
Start point
End point
Start point
S
0
Waveform
S
1
Appendix
 Loading...