10-20
IM DLM6054-01EN
10.4 Viewing the Phase between Measured
Waveforms on the XY Display
You can specify up to two XY waveforms (Analysis1 and Analysis2) and display them in the Analysis
window.
Procedure
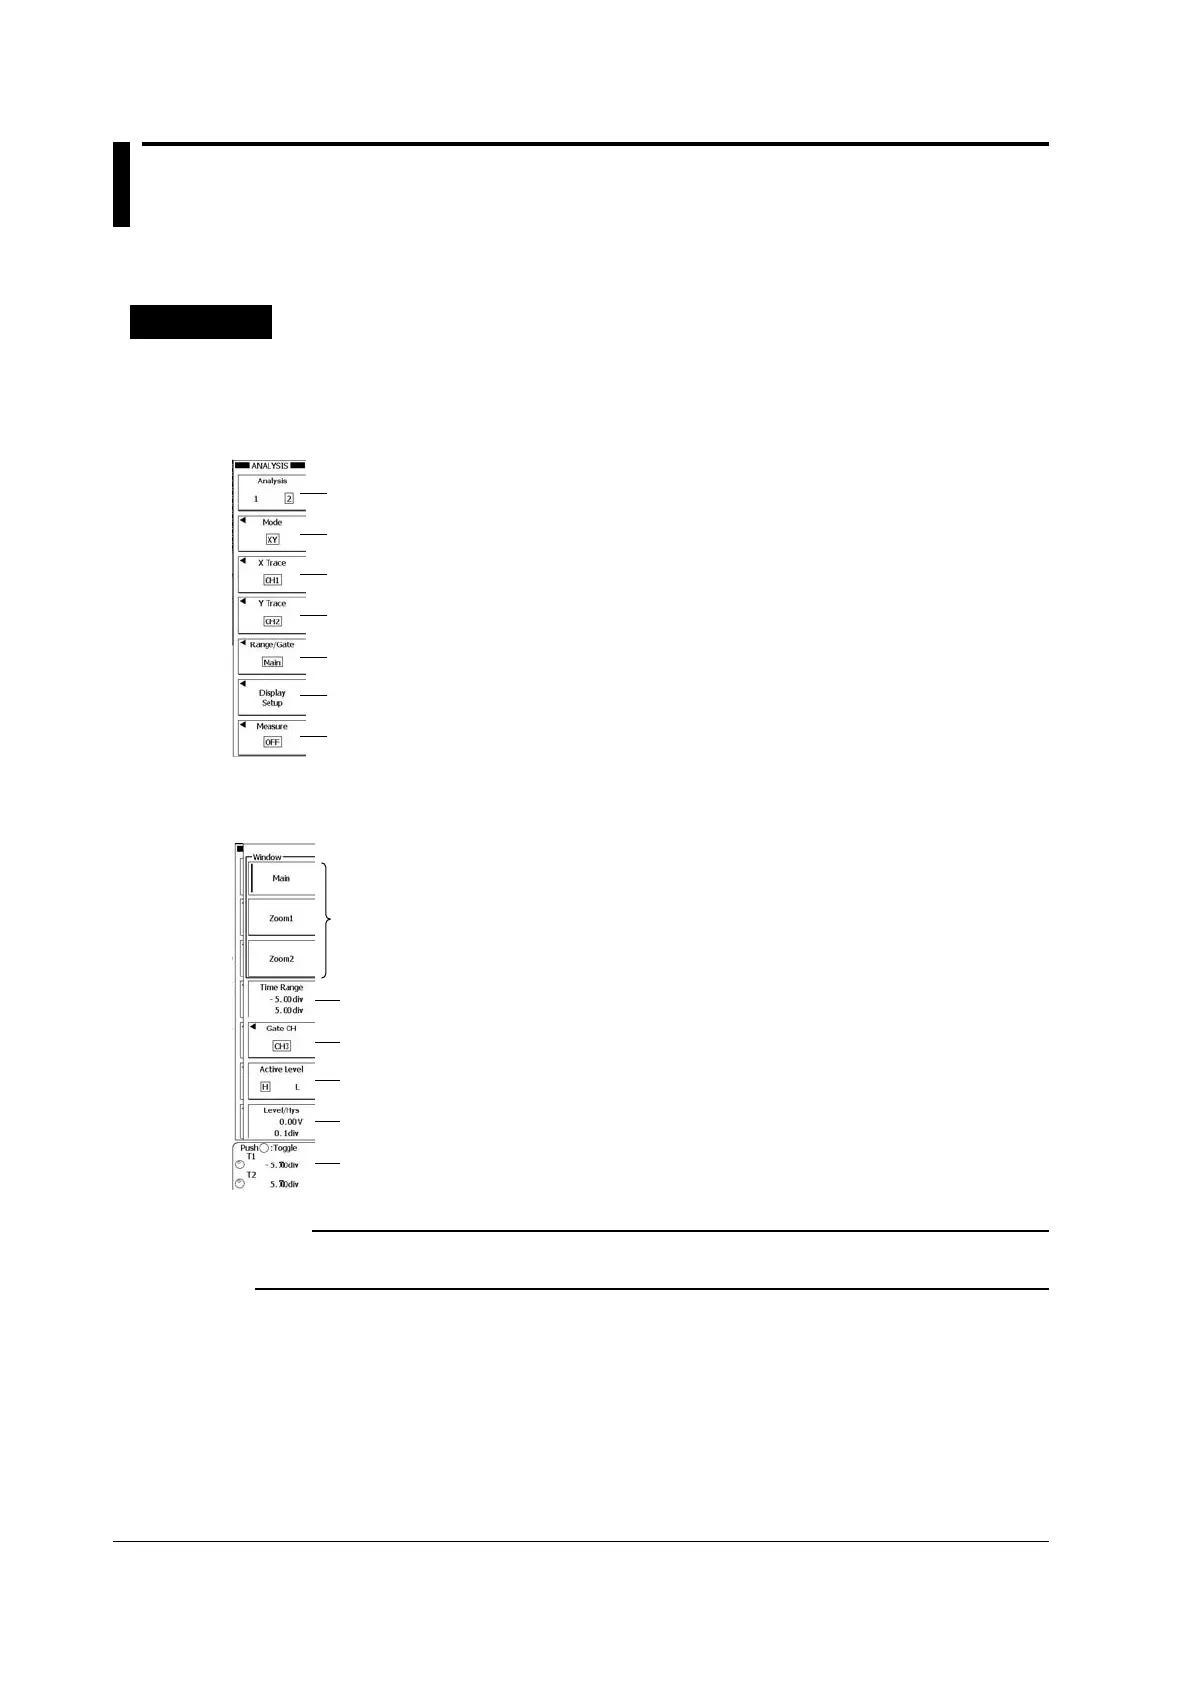
ANALYSIS XY Menu
Press SHIFT+DISPLAY (XY) to display the following menu.
You can also display the following menu by pressing ANALYSIS and then pressing the Mode soft key
to select XY.
Set the analysis number (1, 2).
The analysis type is XY.
Set the X-axis waveform.
Set the Y-axis waveform.
Press to set the time range and the gate channel.
Press to turn the VT waveform display on or off.
Set the analysis feature (OFF, Cursor, Integ XY).
Setting the Time Range and the Gate Channel (Range/Gate)
Press the Range/Gate soft key to display the following menu.
Set the start (T1) and stop (T2) points (using the jog shuttle).
Set the gate channel (CH1–CH4, M1–M4).
Set the active level (H, L).
Set the reference level and the hysteresis (using the jog shuttle).
Set the start point, stop point, reference level, and hysteresis.
Select the window within which you want to set the time range.
Note
When you press
SHIFT+DISPLAY
(XY) to display the ANALYSIS XY menu, the menu for Analysis 2
appears.
 Loading...