10-29
IM DLM6054-01EN
Analysis and Searching
10
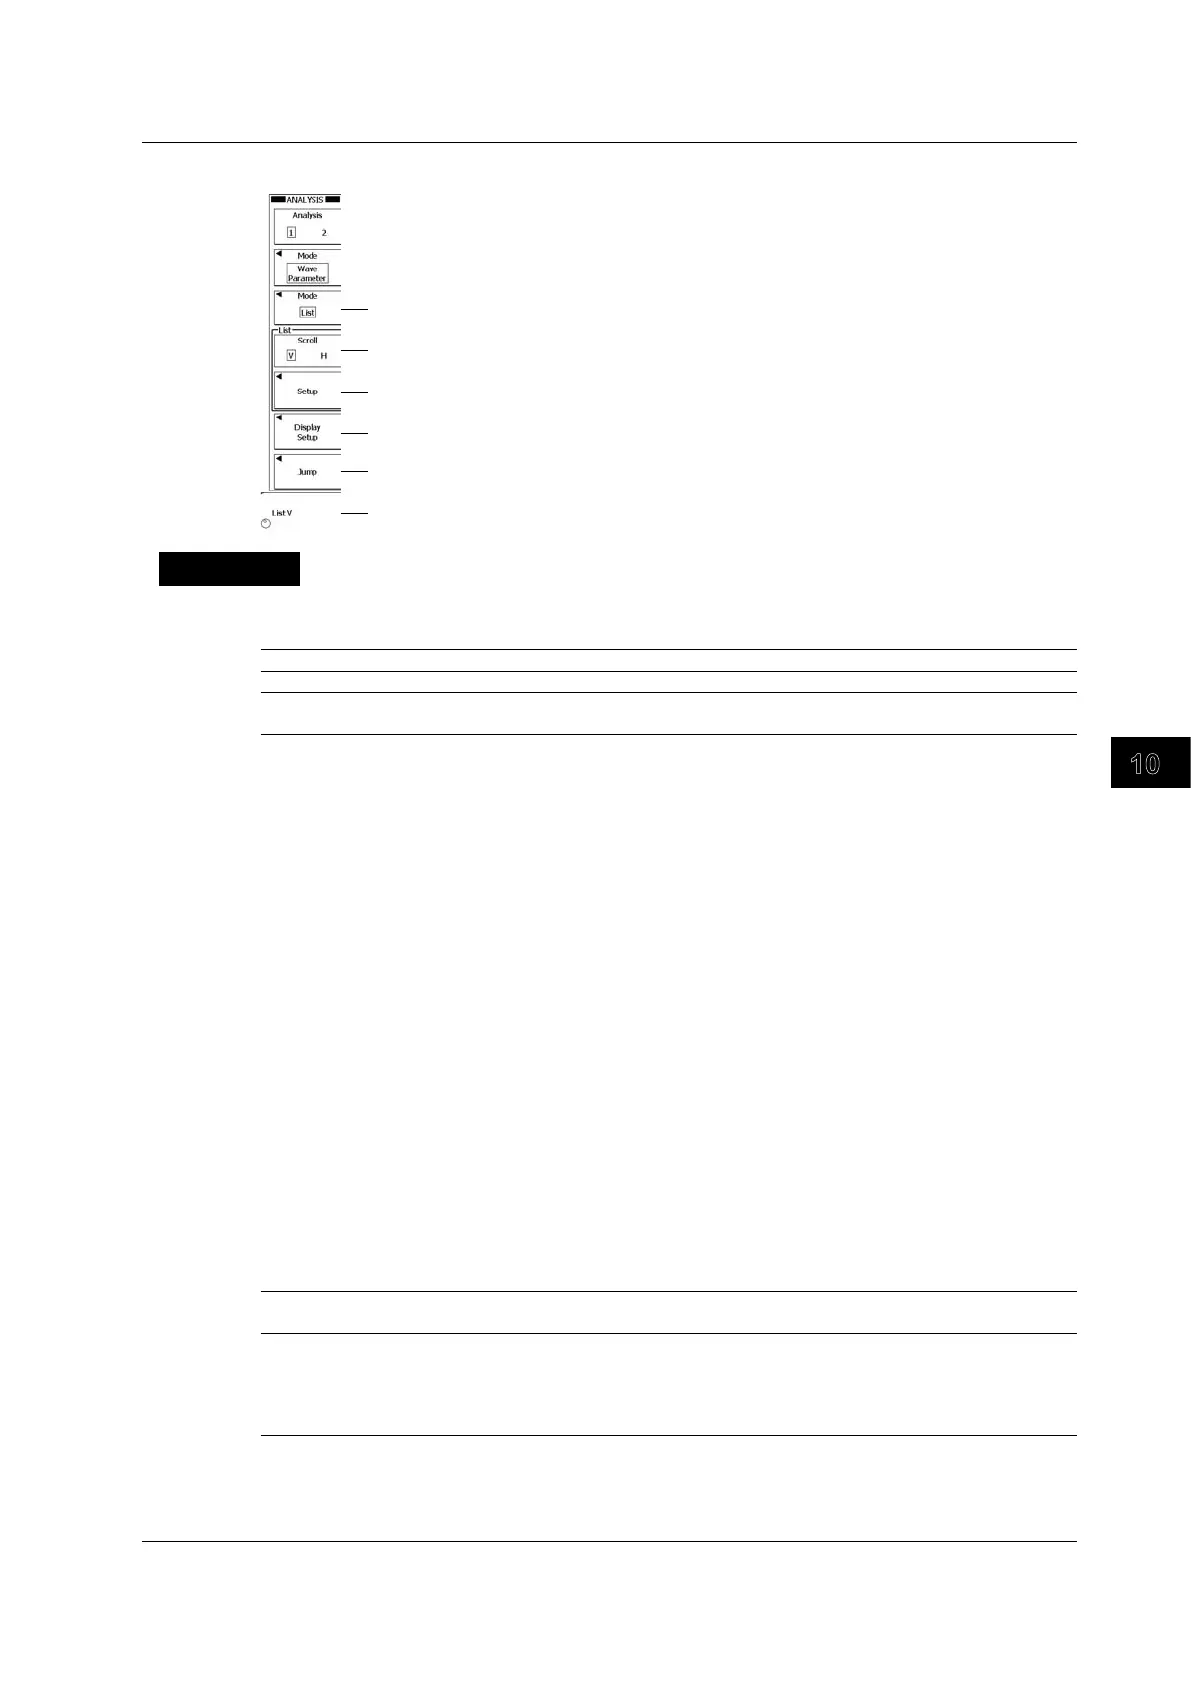
Configuring the List Display (List)
Set the display mode to List.
Set the direction to scroll in (V for vertical or H for horizontal).
Press to set the list type (Trend, Statistics) and the scroll amount
(1, 10, 100, 1000, 10000).
Press to turn the VT waveform display on or off.
Move to a specific location (Latest, Oldest, Max, Min).
Scroll the list up, down, left, or right.
Explanation
Display Mode (Display Mode)
You can select one of the following options.
Histogram A histogram of the results is displayed.
Trend A trend of the results is displayed.
List A list of the results is displayed. All the results for the selected automated waveform parameter
measurement items are displayed.
Measurement Item to Display (Item)
You can select one automated waveform parameter measurement item and display its histogram or
trend.
The measurement items that you can select vary as indicated below depending on the measurement
mode that you select in the MEASURE menu.
• When the Mode Is Basic, Continuous Statistics, or History
Statistics
Area/Calc: You can select a measurement item from Area1, Area2, or Calc.
Trace: You can set the measurement source waveform to a channel from CH1 to CH4, M1
to M4, or Logic.
• When the Mode Is Cycle Statistics
Select: You can select a measurement item from Basic or Calc.
Trace: You can set the measurement source waveform to a channel from CH1 to CH4, M1 to
M4, or Logic.
Displayed Trend Points (H Span)
You can set the number of trend points to show in the trend display. The trend of the specified number
of measured values starting from the latest measured result is displayed. The maximum number of
displayable trend points is 100,000 (when a single item is selected).
Executing Auto Scale (Auto Scale Exec)
When you are displaying a trend, you can execute Auto Scale to adjust Upper, Lower, and H Span in
the manner described below.
Upper and Lower Upper and lower are set so that the difference between the maximum and minimum values of
the waveform parameter is 80% of the waveform area.
H Span H Span is set so that all the waveform parameter values that were measured before Auto Scale
was executed are displayed.
If the automated waveform parameter measurement mode is Basic or Continuous Statistics
and the number of waveform parameters that had been measured is less than or equal to 100,
H-Span is set to 100.
Displayed Waveform Area (H Range)
When you are displaying a trend and the automated waveform parameter measurement mode is Cycle
Statistics, you can choose to display the main, Zoom1, or Zoom2 waveform area.
10.6 Displaying Histograms, Trends, and Lists of Automated Measurements of Waveform Parameters
 Loading...