10-33
IM DLM6054-01EN
Analysis and Searching
10
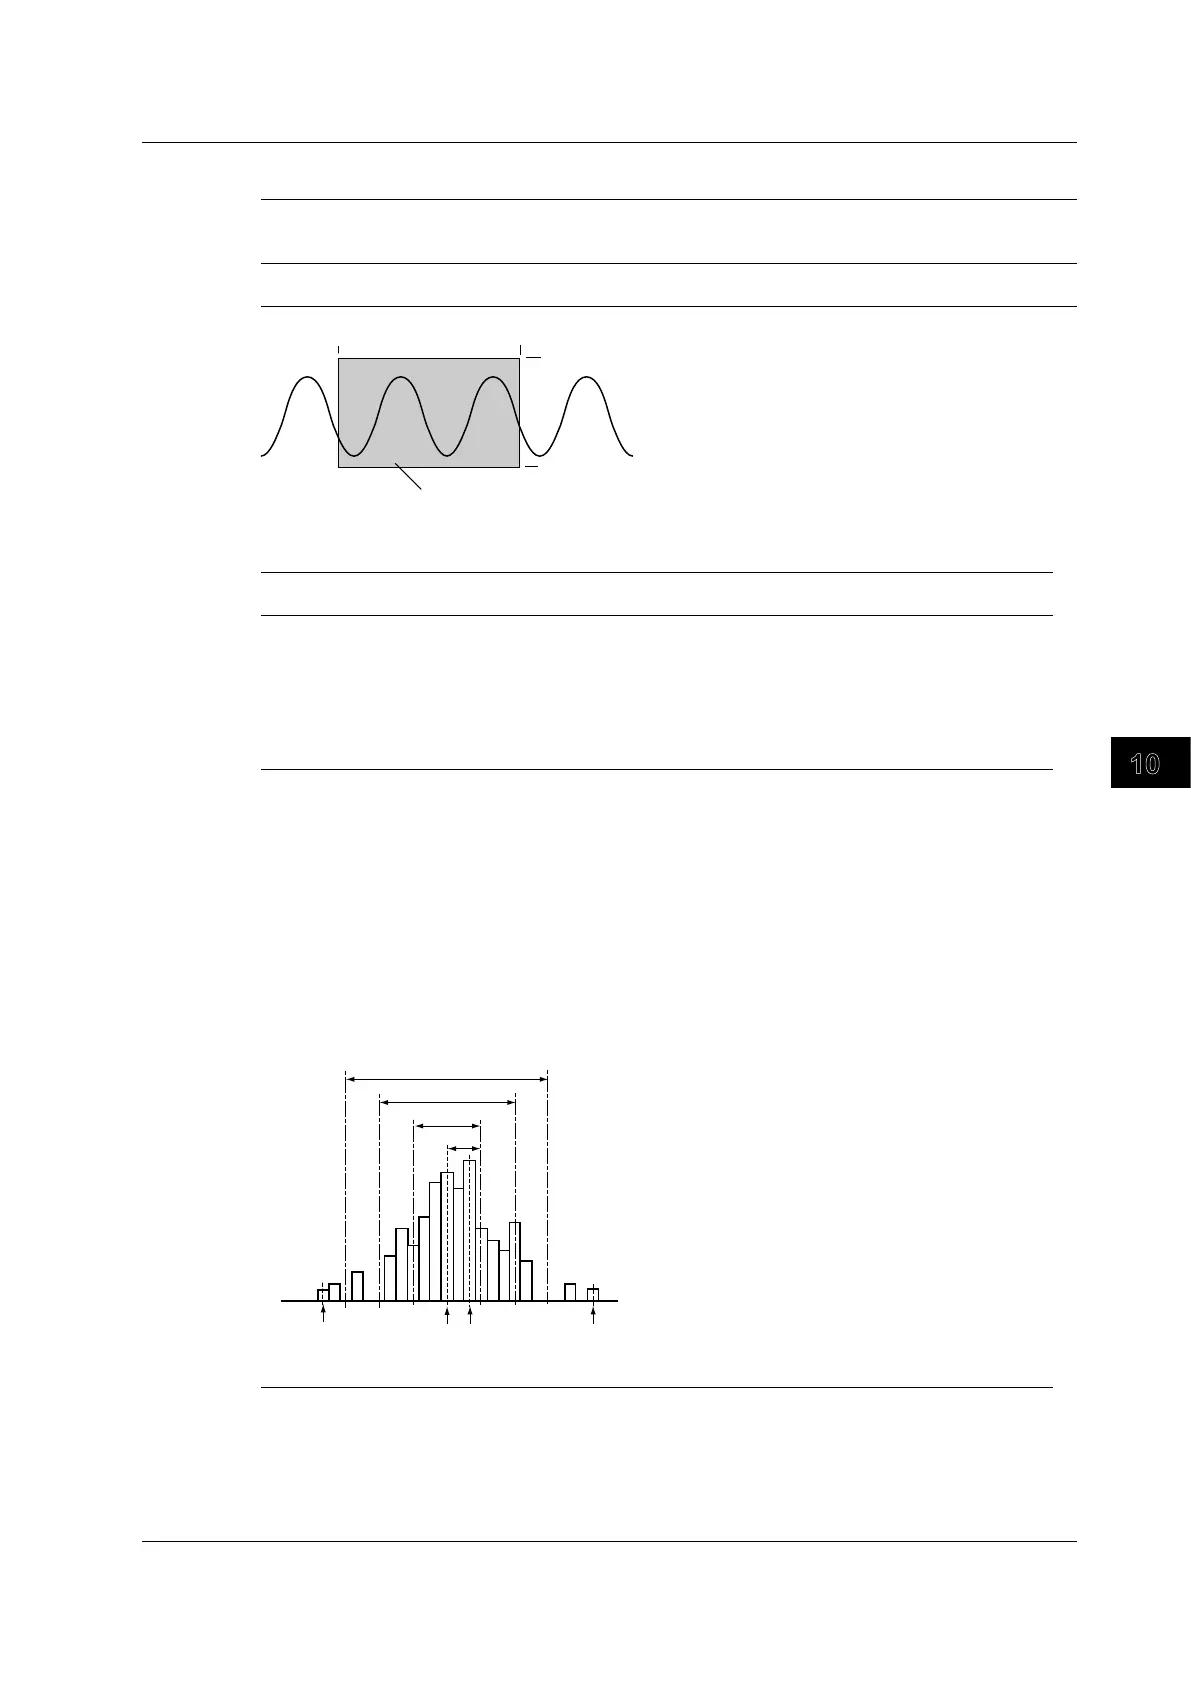
Source Area (Upper/Lower and Left/Right)
Upper/Lower
You can set the horizontal range of the area that you want to use to create a histogram to an area within ±4
divisions.
Left/Right
You can set the vertical range of the area that you want to use to create a histogram to an area within ±4 divisions.
Upper
Lower
Left
The histogram of the data within this range is displayed.
Analysis (Measure)
OFF
Analysis is disabled.
Cursor
C1 The measured value at cursor C1 is displayed.
*
C2 The measured value at cursor C2 is displayed.
*
D
C The difference between the measured values of cursors C1 and C2 is displayed.
Calc1 to Calc4 The value that results from the specified calculation is displayed.
* When the axis is set to H, you can move two vertical cursors and mea
sure their vertical values.
When the axis is set to V, you can move two horizontal cursors and measure their horizontal-axis values.
Param
You can display the following parameter values for histograms of the two specified areas (Area1 and Area2).
Peak Point Peak value
Max Point Maximum value
Min Point Minimum value
Median Median
*
Mean Mean value
σ
Standard deviation of the histogram
Rms Rms value
Integ±
σ
Percentage of values that fall within ±
σ
Integ±2
σ
Percentage of values that fall within ±2
σ
Integ±3
σ
Percentage of values that fall within ±3
σ
Calc1 to Calc4
σ
±
σ
±2
σ
Max
Min
The value that results from the specified calculation
* The sampled points are sorted from the minimum to the maximum value, and the middle number is
determined.
10.7 Displaying the Frequency Distribution of a Specified Area (Accum Histogram)
 Loading...