74
S:\Hp8960\E1962B CDMA 2000\Pi Release\Reference Guide\Chapters\cdma2000_meas_wquality_desc.fm
Waveform Quality/Code Domain Measurement Description
Code Domain Power Graphical Display
The Code Domain Power measurement displays up to 16 I-channel and up to 16 Q-channel bins
1
. Each bin
represents one active code channel. The IS-2000 system achieves high data rates by combining multiple code
channels. To facilitate the display of high data rate channels in contiguous blocks, the Walsh code sequence
along the graph’s x-axis is displayed in “bit reversed” order. See Table 7. “Walsh Numbering on Code Domain
Power Graphs”
To facilitate the display of measurement results in contiguous blocks the Walsh code sequence along the
graph’s x-axis is displayed in “bit reversed” order. See Table 7. “Walsh Numbering on Code Domain Power
Graphs”
The power and power + noise graphs, because of the bit-reversed order, can display channels with a spreading
factor of less than 16, such as the R-SCH (Reverse Supplemental CHannel), using one bin. For example,
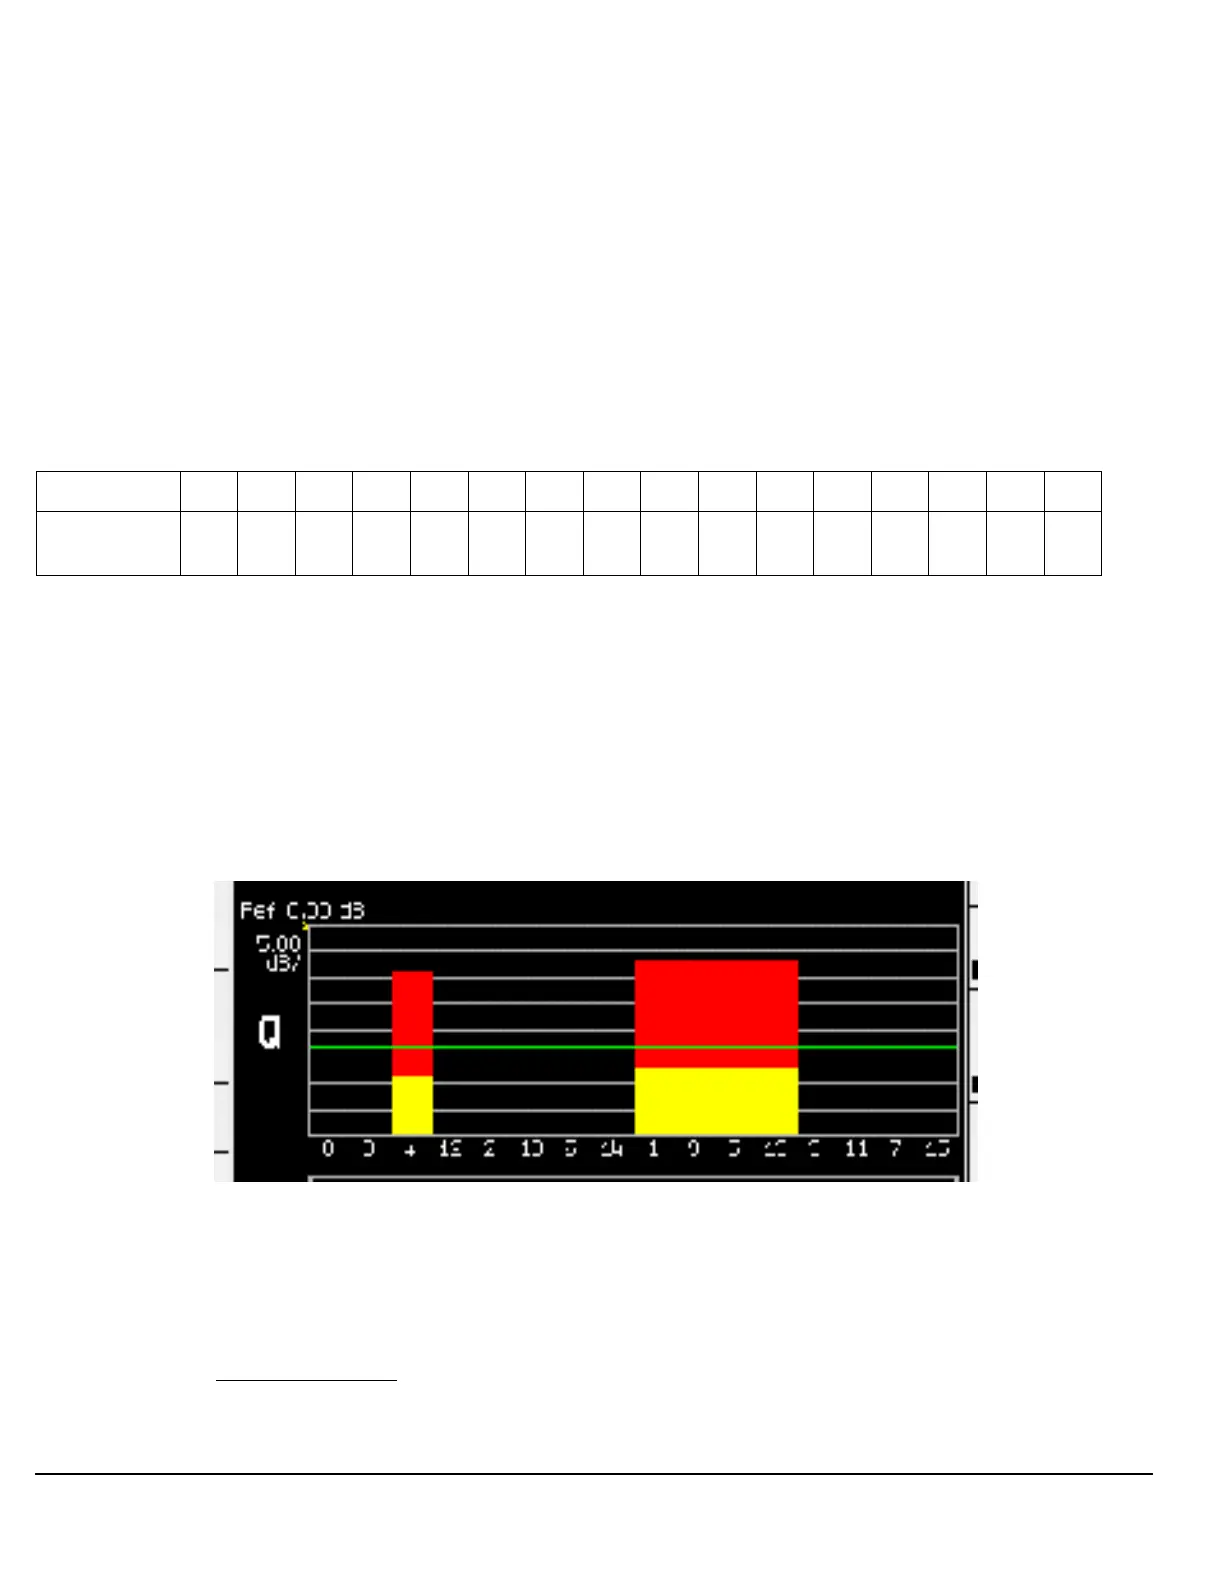
Figure 8. shows the Q channel with:
• the R-FCH (Reverse Fundamental CHannel) in bin 1 on channel 4,
• the R-SCH in bin 2 on channel 1 (composed of channels 1, 9, 5, 13),
Figure 8. Code Domain Power Graph with R-SCH
An example of bit reversal is shown in Figure 9. Bin 13 has a binary coded decimal value of 1101. If you
reverse that sequence, the result is 1011. When 1011 is converted back to a decimal value, the result is Walsh
code 11.
1. Bins are the bars that appear on the graph. When high data rate channels such as the F-SCH channel are transmitted from the
mobile station, wider bins are displayed. The wider bins represent code channels that occupy multiple orthogonal channels.
Table 7. Walsh Numbering on Code Domain Power Graphs
Bin Number0123456789101112131415
Walsh Code
Channel
0841221061419513311715
 Loading...