Commonly Used Procedures 6
Agilent Nano Indenter G200 User’s Guide 6-76
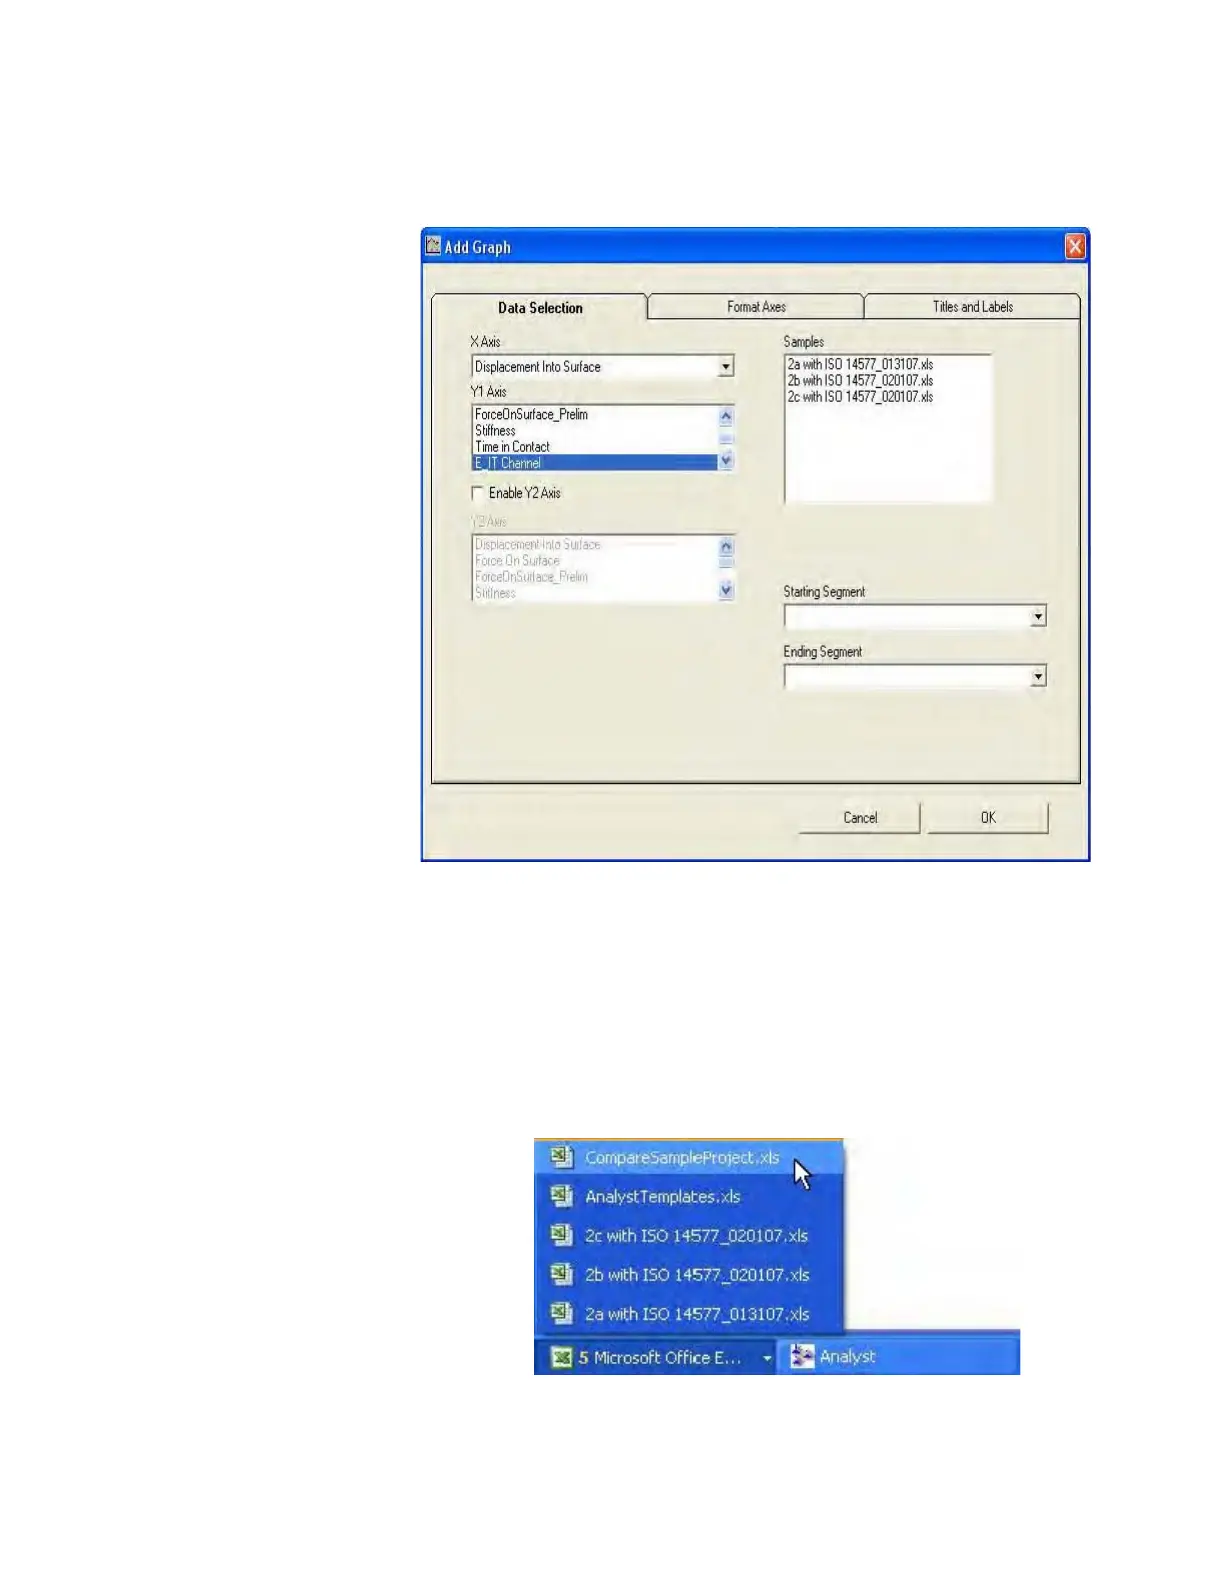
Figure 6-102Add Graph dialog box
Analyst automatically generates a graph and places the graph in the
Excel workbook for the project.
14 To see the plot, select the workbook for the project from the
Windows toolbar, as shown in
Figure 6-103.
Figure 6-103Select a project workbook from Windows
 Loading...