Commonly Used Procedures 6
Agilent Nano Indenter G200 User’s Guide 6-75
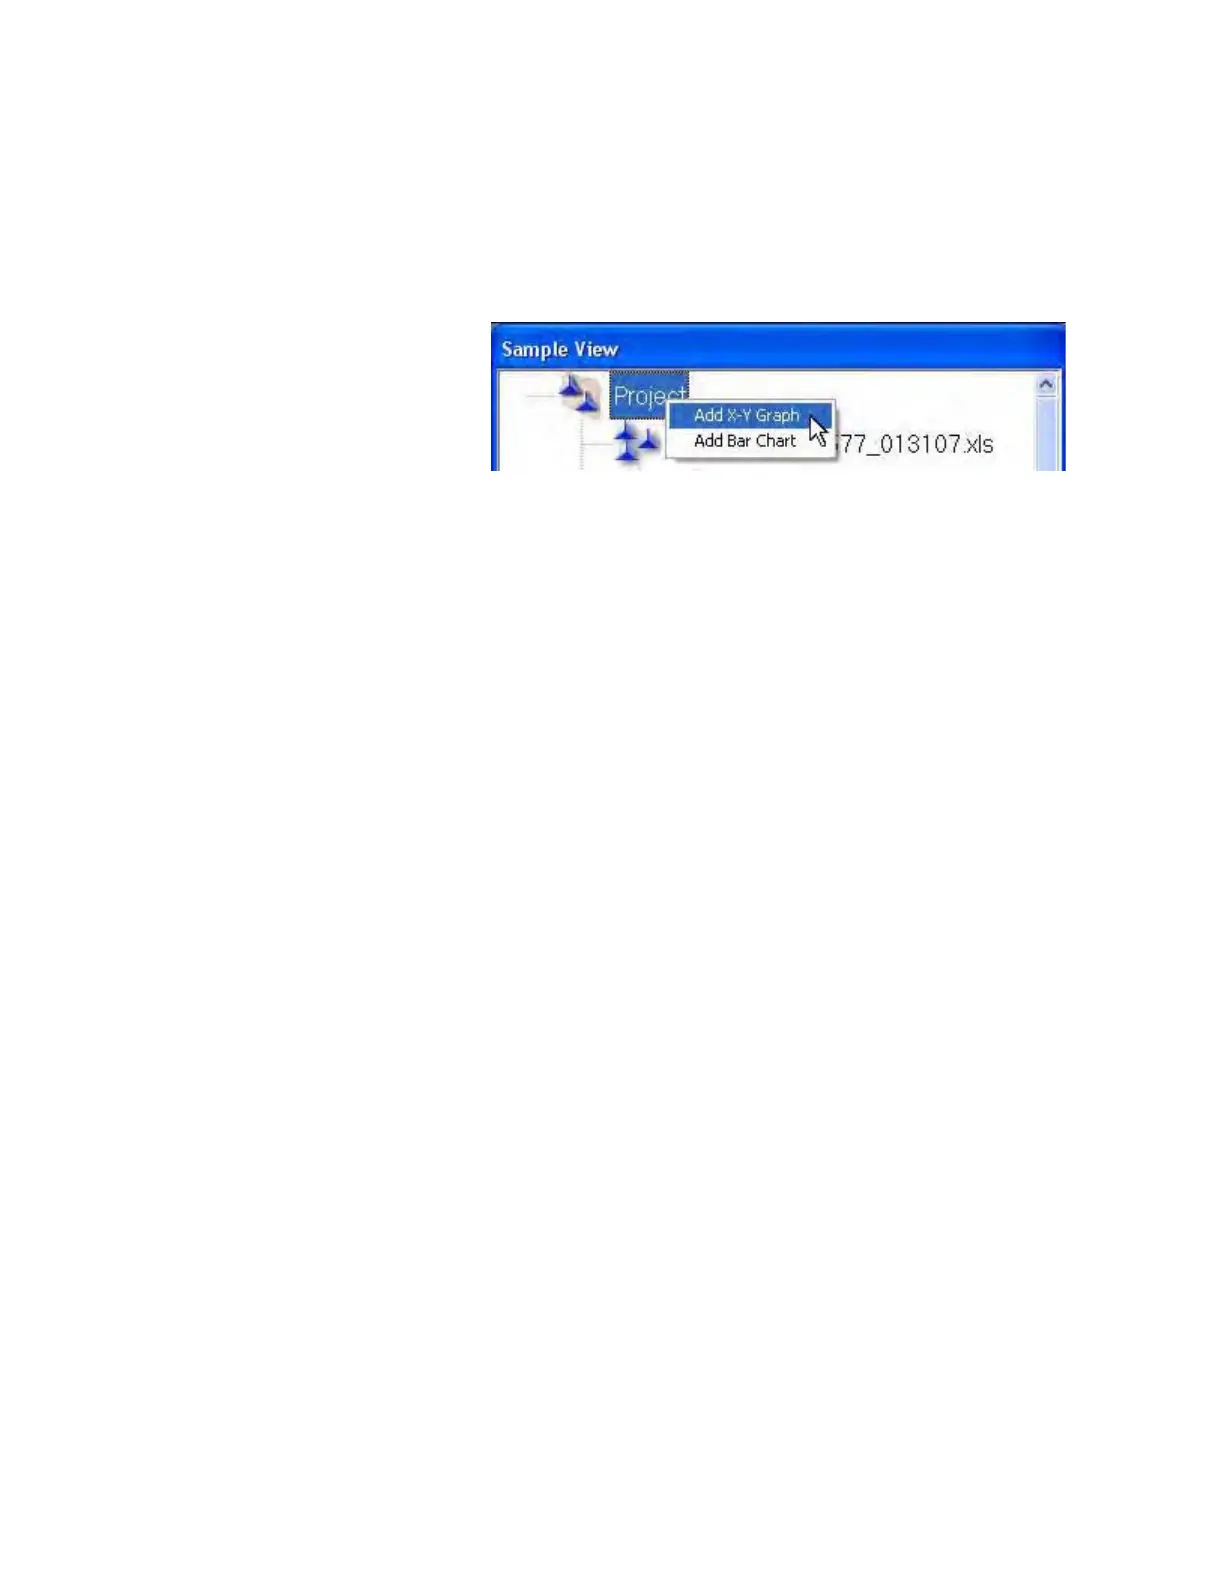
11 In the Sample View Pane, right-click on the project level and select
Add X-Y Graph from the resulting pop-up menu, as shown in
Figure 6-101.
Figure 6-101Select Add X-Y Graph from right-click menu
12 In the Add Graph dialog box (Figure 6-102 on page 6-76):
a Select the desired X axis (such as Displacement Into Surface)
from the X Axis drop-down menu.
b Select the desired Y axis (such as E IT Channel) from the YI
Axis drop-down menu.
c Select the samples to be used in the comparison in the Samples
list, or
d If no samples are selected, then all samples will be included.
13 Click OK.
 Loading...