Quick Start Guide 2
Agilent Nano Indenter G200 User’s Guide 2-45
5 Use the cursor to zoom in on the apex of the load-displacement
curve. Click and drag to zoom in on the desired area, as shown in
Figure 2-62.
Figure 2-62Apex of Load-Displacement curve
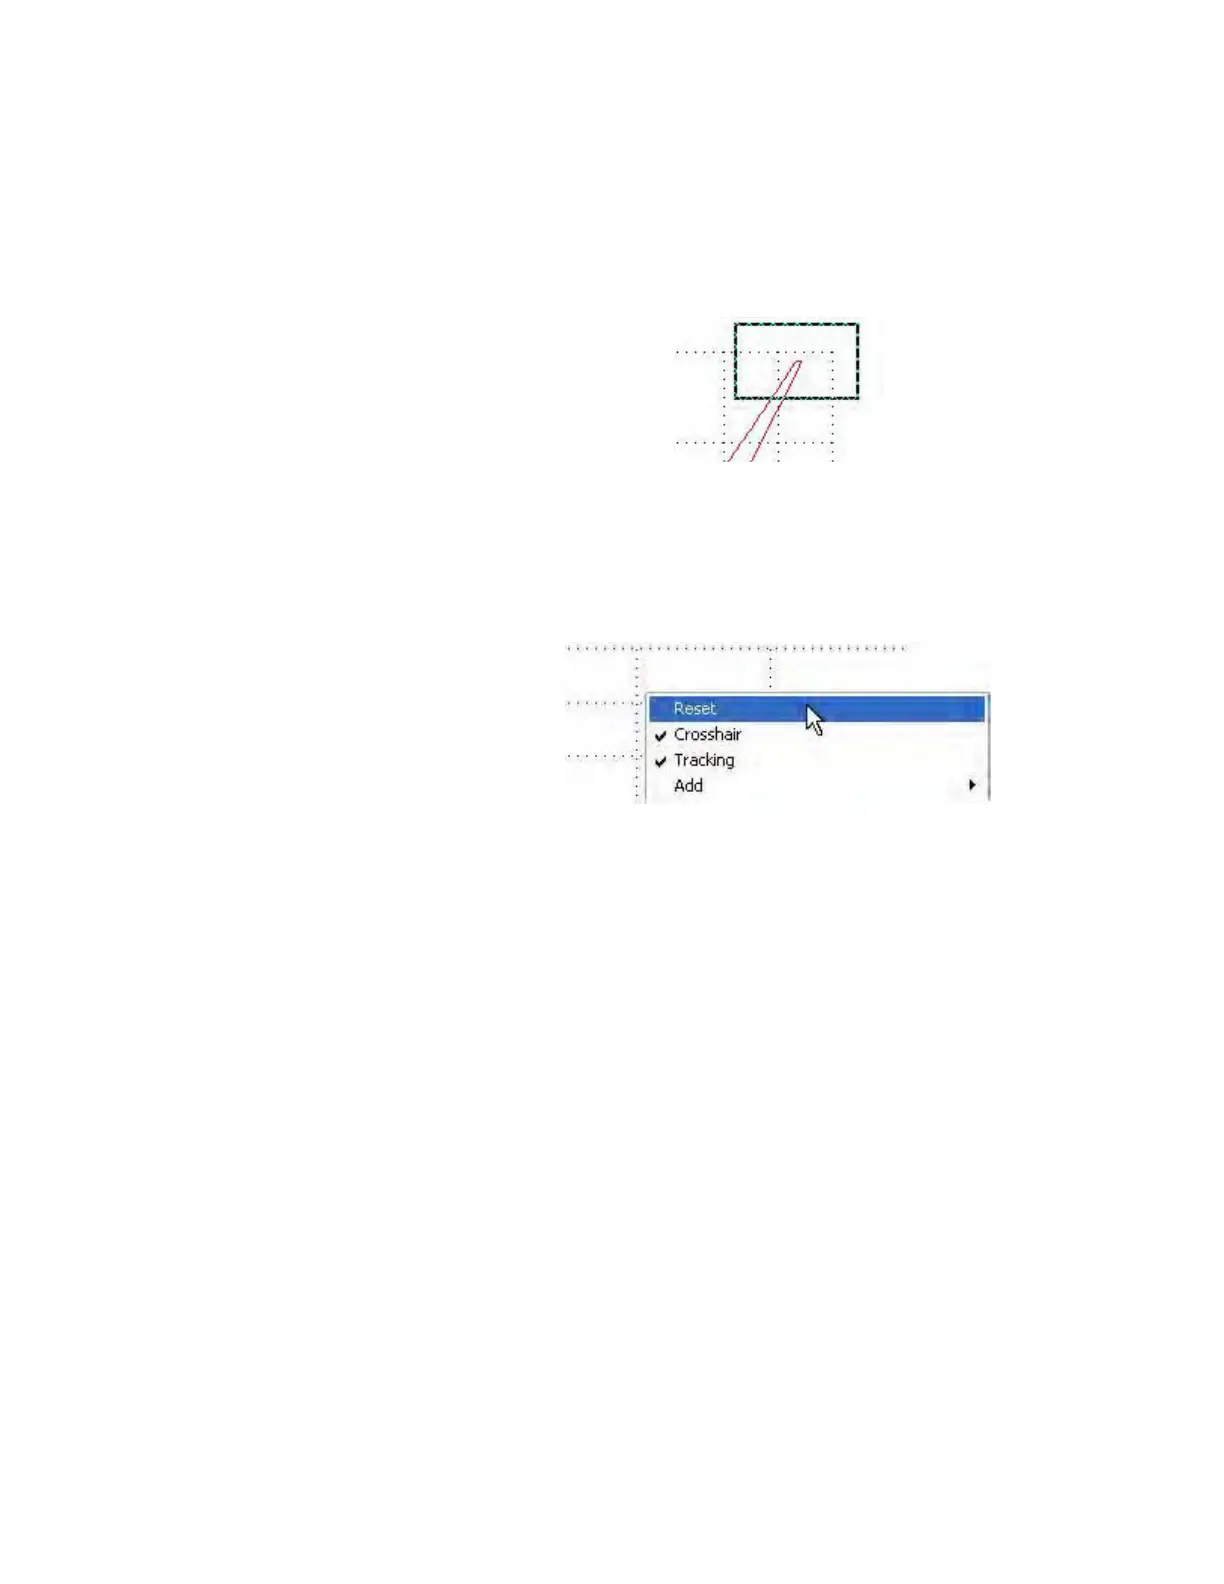
6 To view the entire curve, right-click anywhere in the graph and select
Reset from the pop-up menu, as shown in
Figure 2-63.
Figure 2-63Select Reset from right-click menu
7 Right-click anywhere on the graph and select X-Axis Channel >
Time
(s) from the resulting pop-up menu, as shown in Figure 2-64
on page 2-46.
 Loading...