44
Cedex HiRes Analyzer Operator’s Guide
C
C
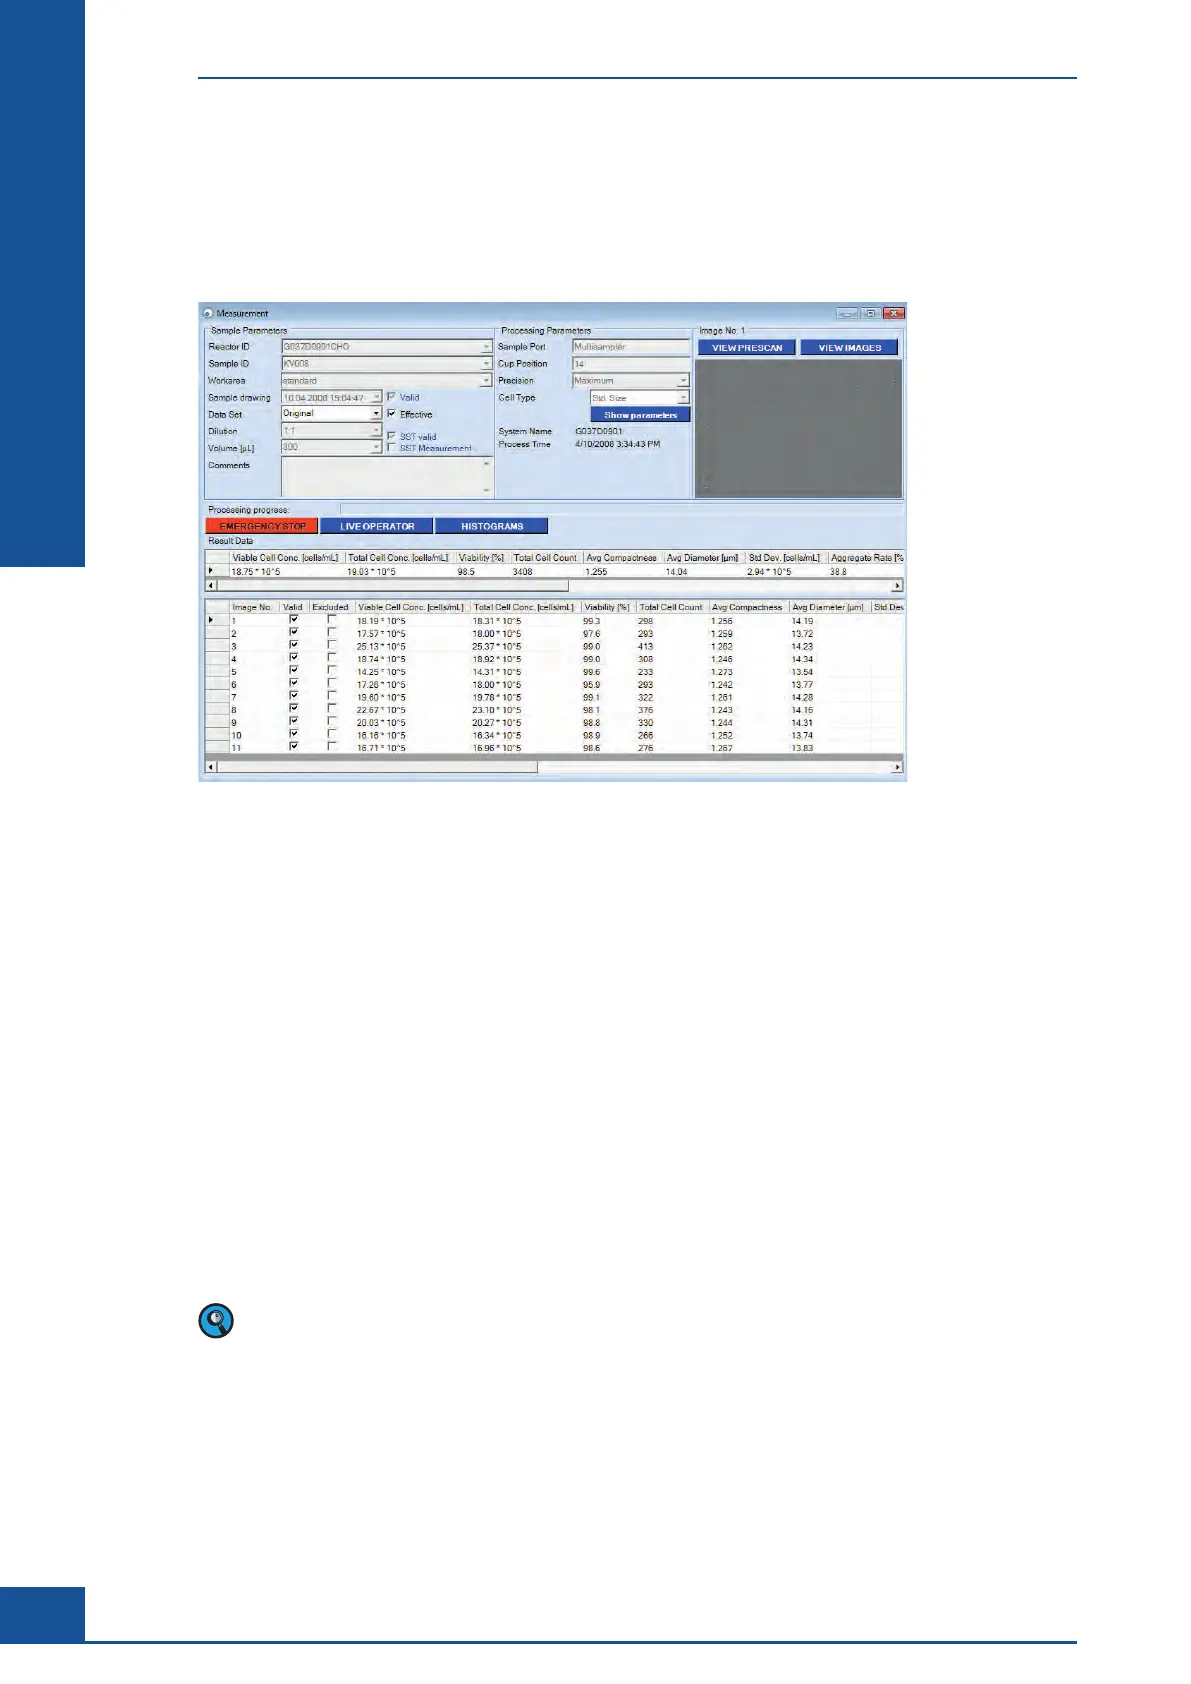
4.1 Result Data Area
The Result Data area in the bottom half of the Measurement dialog box has two separate sections: the section
just below the words “Result Data” displays the overall results for the measurement, while the section further
down displays the results for each image analyzed.
Figure 11: The Measurement dialog box with results
The parameters shown in the Result Data area for both the overall results and individual image results include:
c
Viable Cell Conc.: Viable cell concentration [× 10
5
cells/mL]
c
Total Cell Conc.: Total cell concentration [× 10
5
cells/mL]
c Viability [%]: Percent viability
c
Total Cell Count: Total number of all cells counted
c
Avg. Compactness: Average compactness of living cells [without unit]
c
Avg. Diameter: Average diameter of living cells [μm]
c Std. Dev.: The deviation from image to image of the number of cells found in each image
c
Aggregate Rate [%]: Percent of cells found in aggregates
c
Dead Cell Conc.: Dead cell concentration [× 10
5
cells/mL]
c Viable Cell Count: The total number of viable cells counted
c
Dead Cell Count: The total number of dead cells counted
c
Total Object Count: The total number of objects counted
The default concentration value for results is expressed in × 10
5
cells/mL. However, concentrations may be
expressed in × 10
6
cells/mL, depending on the setting in the System Options. Refer to “Changing the Exponent”
for more information.
In addition, the Result Data area for the individual images has an Excluded column next to the image number.
Images that could lead to incorrect measurement results during analysis (e.g., due to impurities or large
bubbles), are automatically recognized as invalid and excluded from evaluation by the analysis Software. If this
occurs, the image will be marked with a check in the checkbox of the Excluded column. Depending on the set-
tings for user rights, users can also manually exclude individual images from the calculations or include images
that were automatically excluded by the Software by clicking on the checkbox in this column.
Results Displayed in the Measurement Dialog Box
Result Data Area