64
Cedex HiRes Analyzer Operator’s Guide
C
C
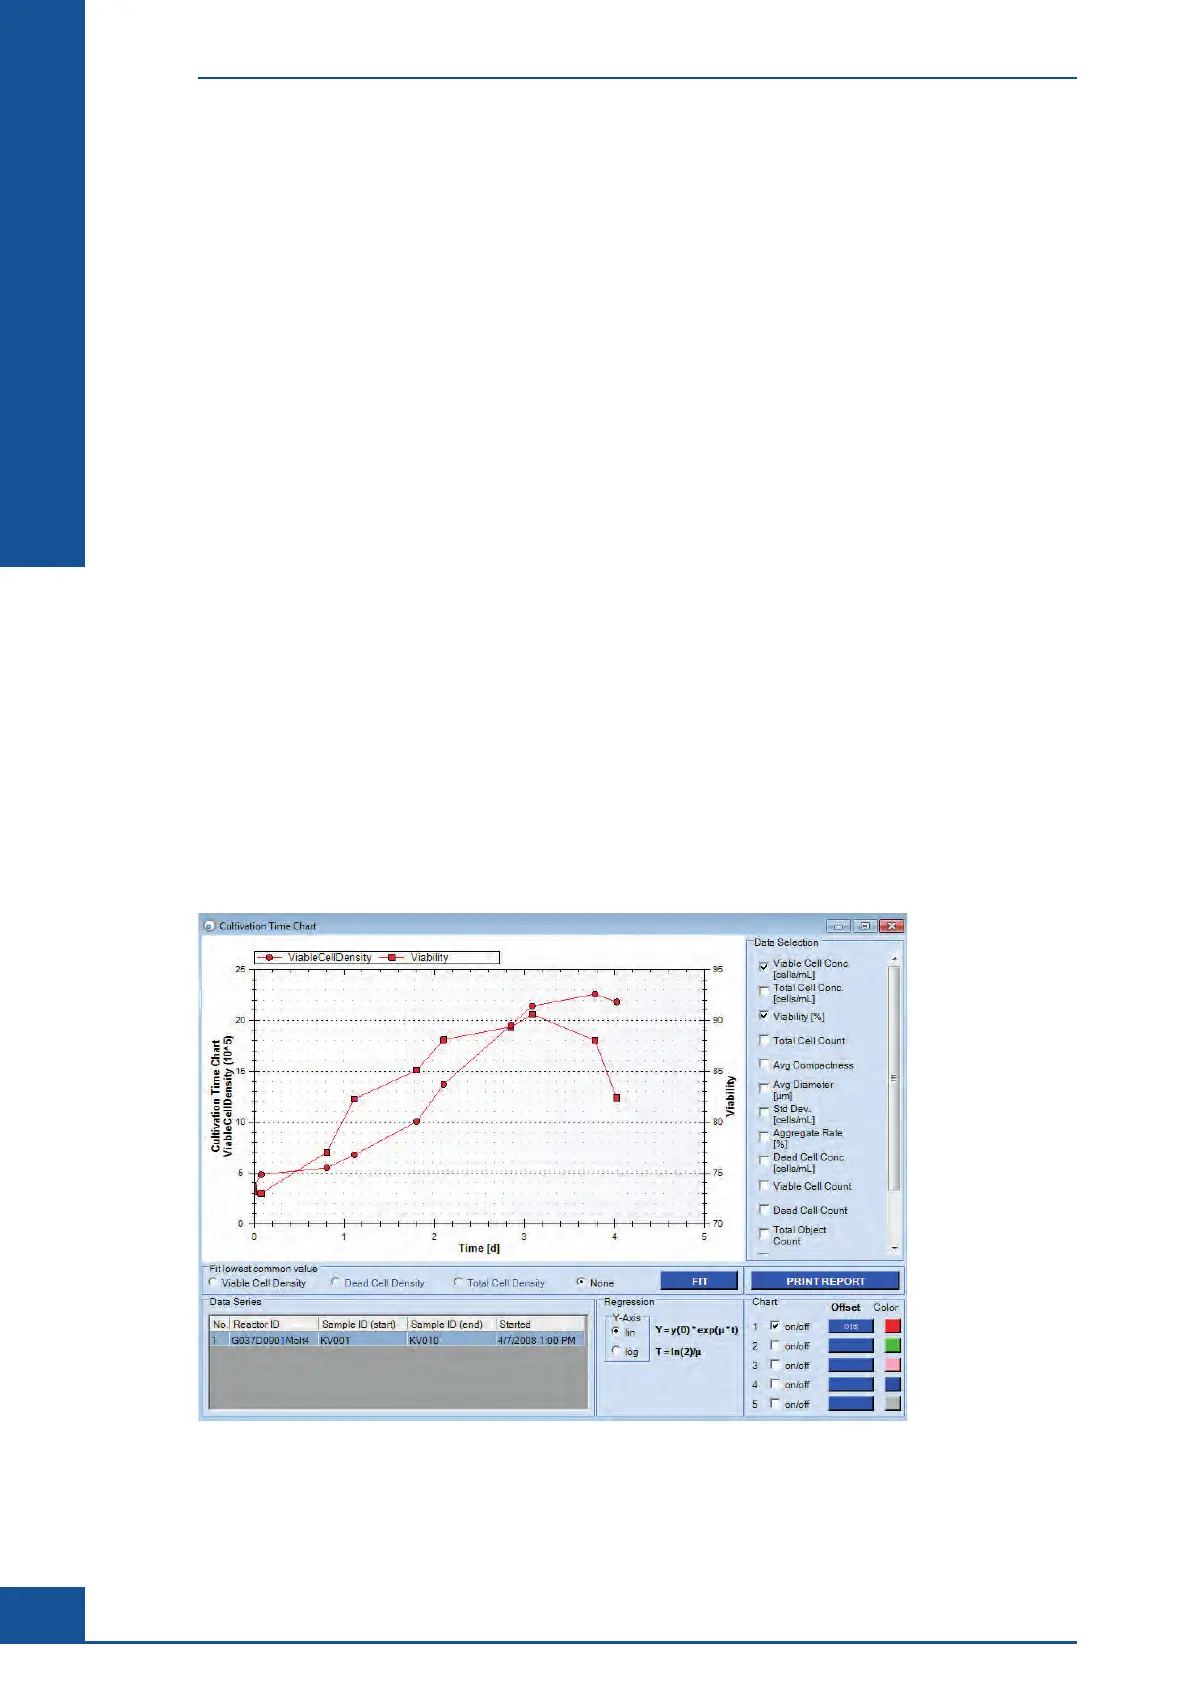
8.2 The Cultivation Time Chart Dialog Box
Once a View has been created with the desired series of measurements to be used for a chart, the Cultivation
Time Chart can be created using the VIEW CHART button.
The Cultivation Time Chart dialog box opens, offering several options for displaying and analyzing the created
CTC.
8.2.1. The Data Selection Area
Which curves should be displayed in the diagram is determined in the Data Selection area of the Cultivation
Time Chart dialog box. The following values can be selected for display:
c
Viable Cell Conc.: Viable cell concentration [× 10
5
cells/mL]
c
Total Cell Conc.: Total cell concentration [× 10
5
cells/mL]
c
Viability [%]: Percent viability
c Total Cell Count: Total number of all cells counted
c
Avg. Compactness: Average compactness of living cells [without unit]
c
Avg. Diameter: Average diameter of living cells [μm]
c Std. Dev.: The deviation from image to image of the number of cells found in each image
c
Aggregate Rate [%]: Percent of cells found in aggregates
c
Dead Cell Conc.: Dead cell concentration [× 10
5
cells/mL]
c Viable Cell Count: The total number of viable cells counted
c
Dead Cell Count: The total number of dead cells counted
c
Total Object Count: The total number of objects counted
Click on the appropriate checkboxes to select the desired values.
Figure 28: Cultivation Time Chart dialog box
Cultivation Time Chart
The Cultivation Time Chart Dialog Box