30
Cedex HiRes Analyzer Software Version 2.4 - Training Guide
C
C
1.2.1 Create a CTC View
A collection of data used for the creation of a particular chart is called a View. Each View can have up to 5
separate series of measurements in order to compare data.
To create a View
1
Click on the CTC button in the Shortcuts area of the Cedex Control Center or select the Cultivation Time Chart
option in the Measurements menu to open the CTC Views dialog box.
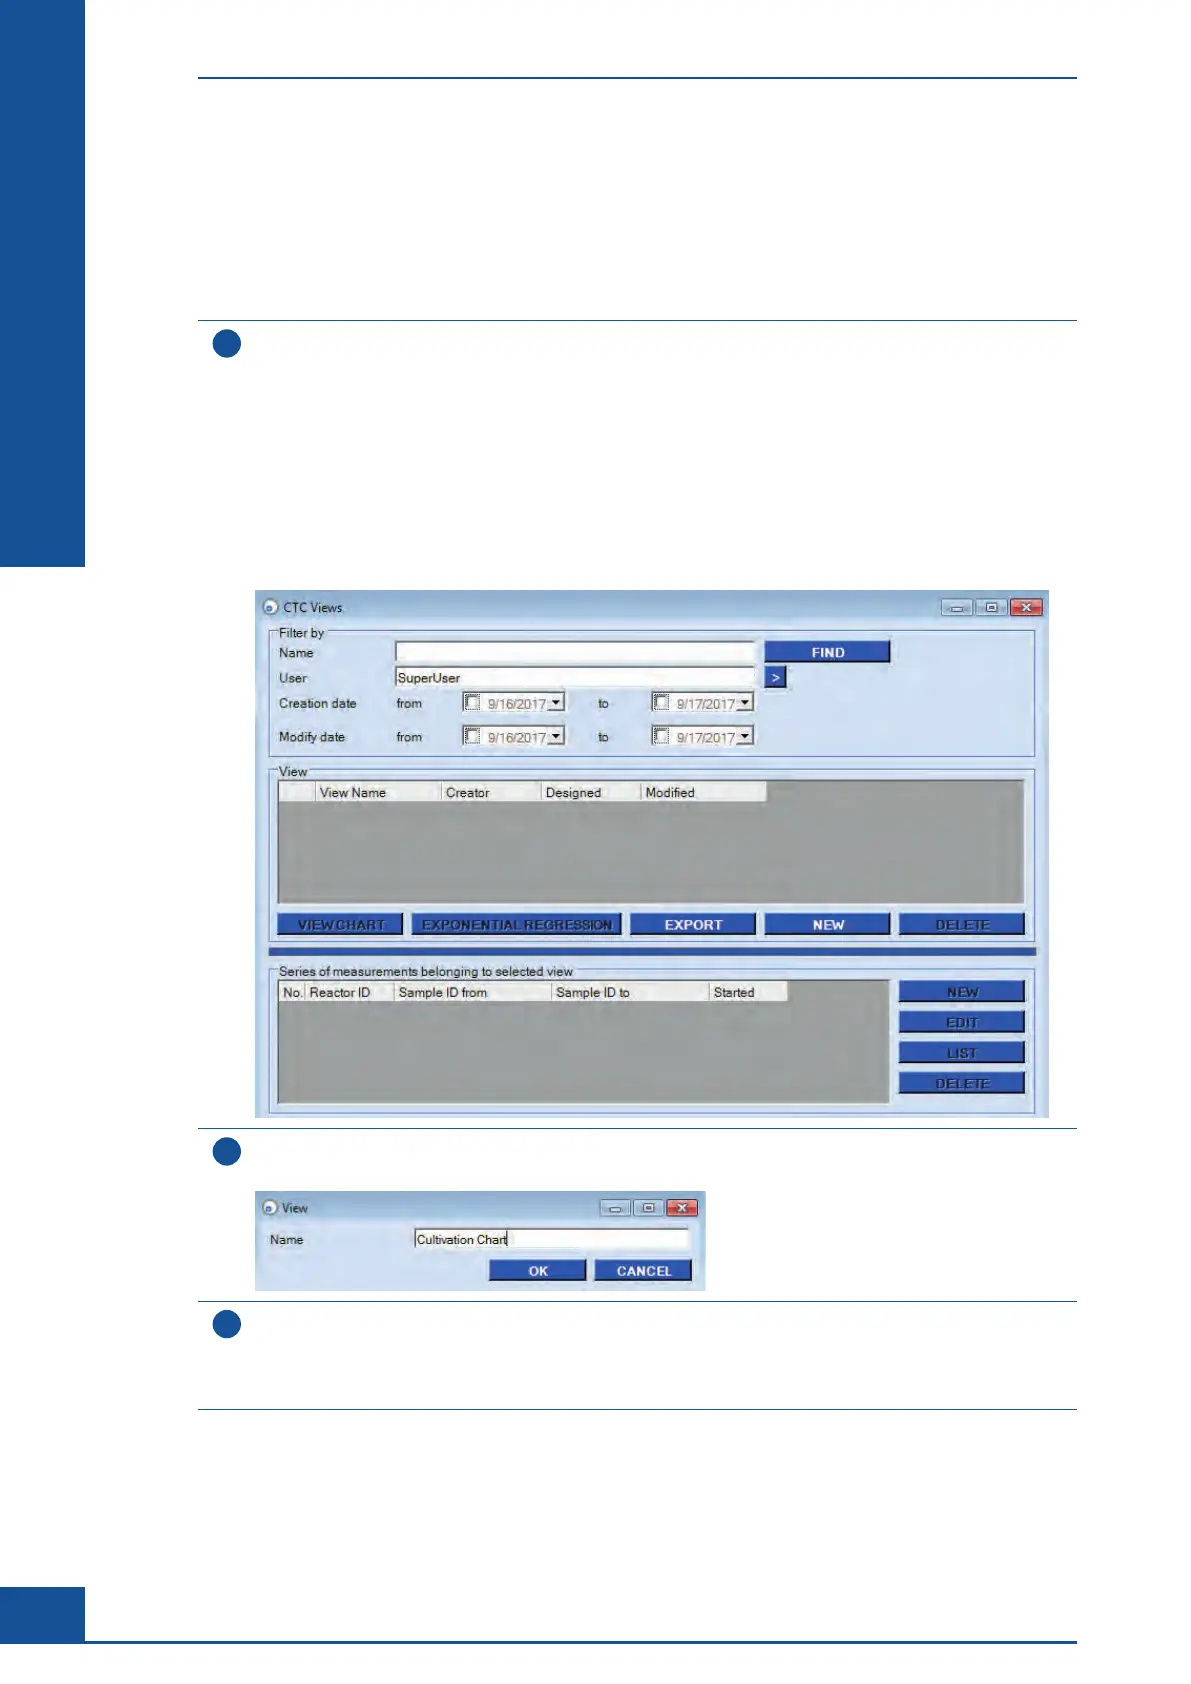
The CTC Views dialog box has three main areas:
c The Filter by area, at the top of the dialog box.
This area can be used to search for specific Views.
c The View area, in the middle of the dialog box.
This is where charts are viewed, exported, created, and deleted.
c The Series of measurements belonging to selected view area at the bottom of the dialog box.
This is where individual series of measurements belonging to the highlighted View are created, edited,
listed, or deleted.
2
Click on the NEW button in the View area. You are prompted for a name for the new View.
A name must be given before a View can be created.
3
Enter a name for the new View and click on OK.
The new View is displayed highlighted in the View area. It is now possible to select the measurements for
this View using the Series of measurements belonging to selected view area in the bottom half of the CTC
Views dialog box, as described in the next chapter.
n
Monitoring Growth of Cells Over Time
Result Analysis