34
Cedex HiRes Analyzer Software Version 2.4 - Training Guide
C
C
10
To add another series of measurements to a View, click on the NEW button again.
The Selection of Data Series dialog box is displayed.
Perform Steps 1 through 9, above, to add further measurements to the new series.
You can add up to 5 separate series to one View. Once 5 series have been added to a View,
the NEW button will no longer be available for that View.
n
1.2.3 Create a CTC Chart Associated with the View to Analyze Pattern of Growth Over Time
Once you have created a View and added the desired series of measurements for that View, you can create the
Cultivation Time Chart.
To Create a Cultivation Time Chart
1
In the CTC Views dialog box, select the View to be used to create a Cultivation Time Chart.
2
Click on the VIEW CHART button.
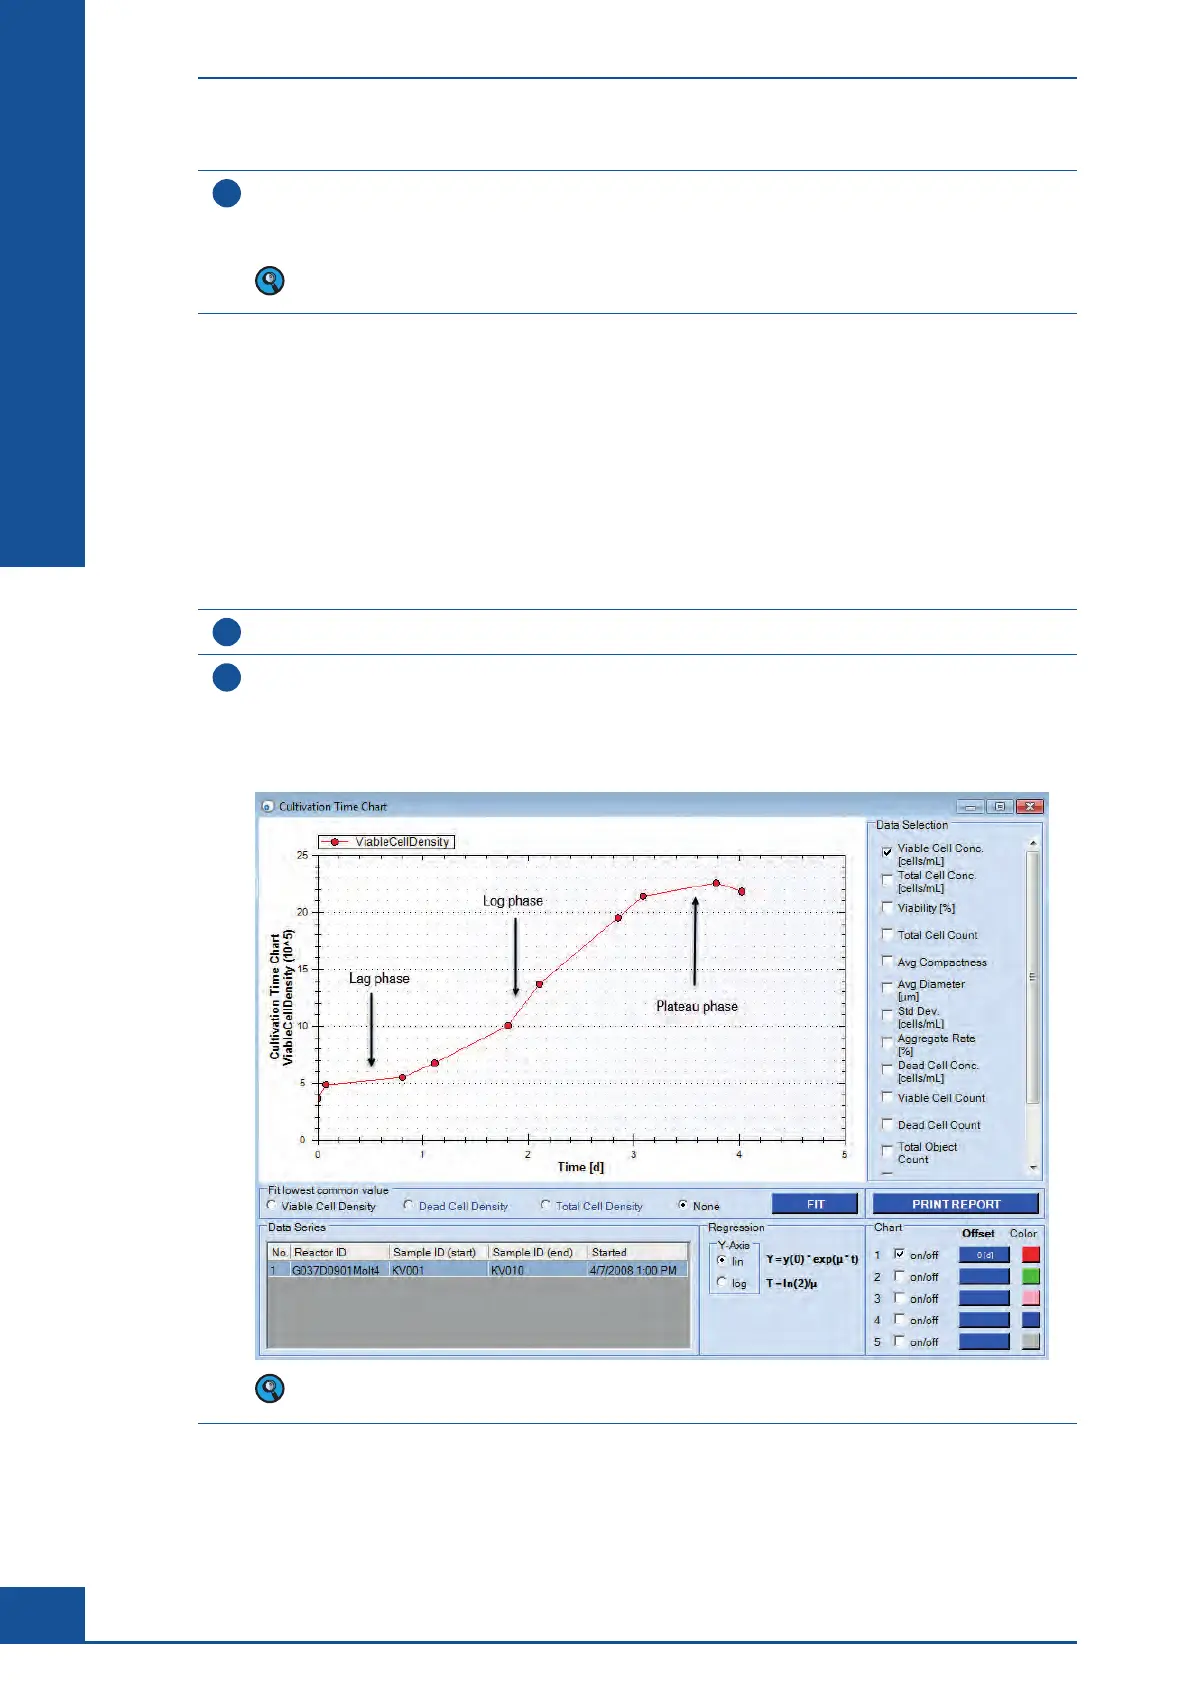
The Cultivation Time Chart dialog box opens with the selected measurements automatically displayed.
By default, the results for Viable Cell Conc. are displayed.
The figure below shows a typical growth pattern of a cell culture from the initial seeding to the limit
in growth:
Only measurements already added to the View will be displayed in the Cultivation Time Chart dialog box
diagram. Use the ‘Selection of Data Series’ dialog box to add additional measurements.
ccc
Monitoring Growth of Cells Over Time
Result Analysis