39
Additional Applications
C
C
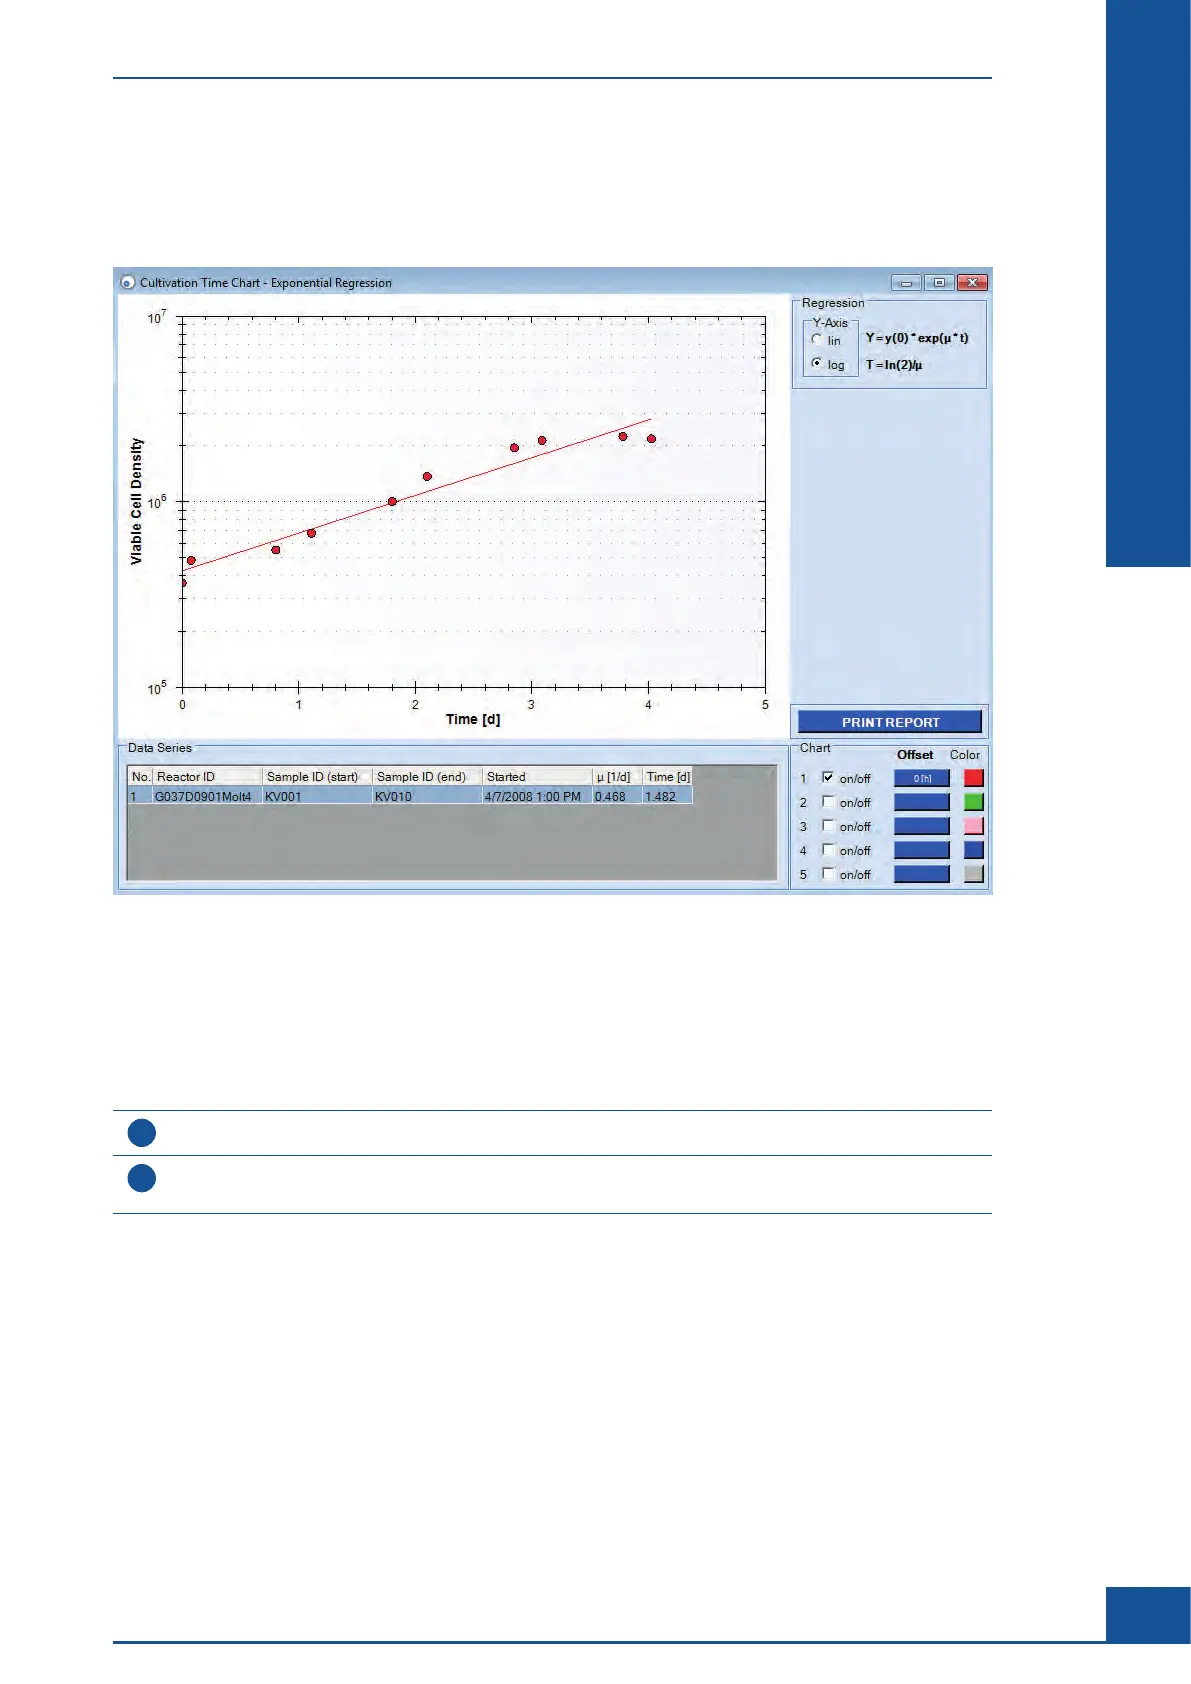
1.2.5 Checking Regression Curve Fitting
If the regression curve does not fit well to the measurement results for viable cell concentration, the specific
growth rate and doubling time may not be as expected for the culture.
The measurement results for viable cell concentration should fit relatively closely to the regression curve
determined for the measurements in the Exponential Regression chart. In this screenshot, measurement results
from samples of the cell culture when it was in the lag and plateau phase were included in the Cultivation Time
Chart and Cultivation Time Chart - Exponential Regression chart. Therefore, the fit and calculated doubling
time are not as expected for the culture.
Perform the following steps:
1
Check the curve for viable cell concentration in the Cultivation Time Chart.
2
Temporarily remove measurement points that are not part of the log phase of growth, using the
Use checkbox in the Selection of Data Series dialog box.
n
Monitoring Growth of Cells Over Time
Result Analysis