38
Cedex HiRes Analyzer Software Version 2.4 - Training Guide
C
C
10
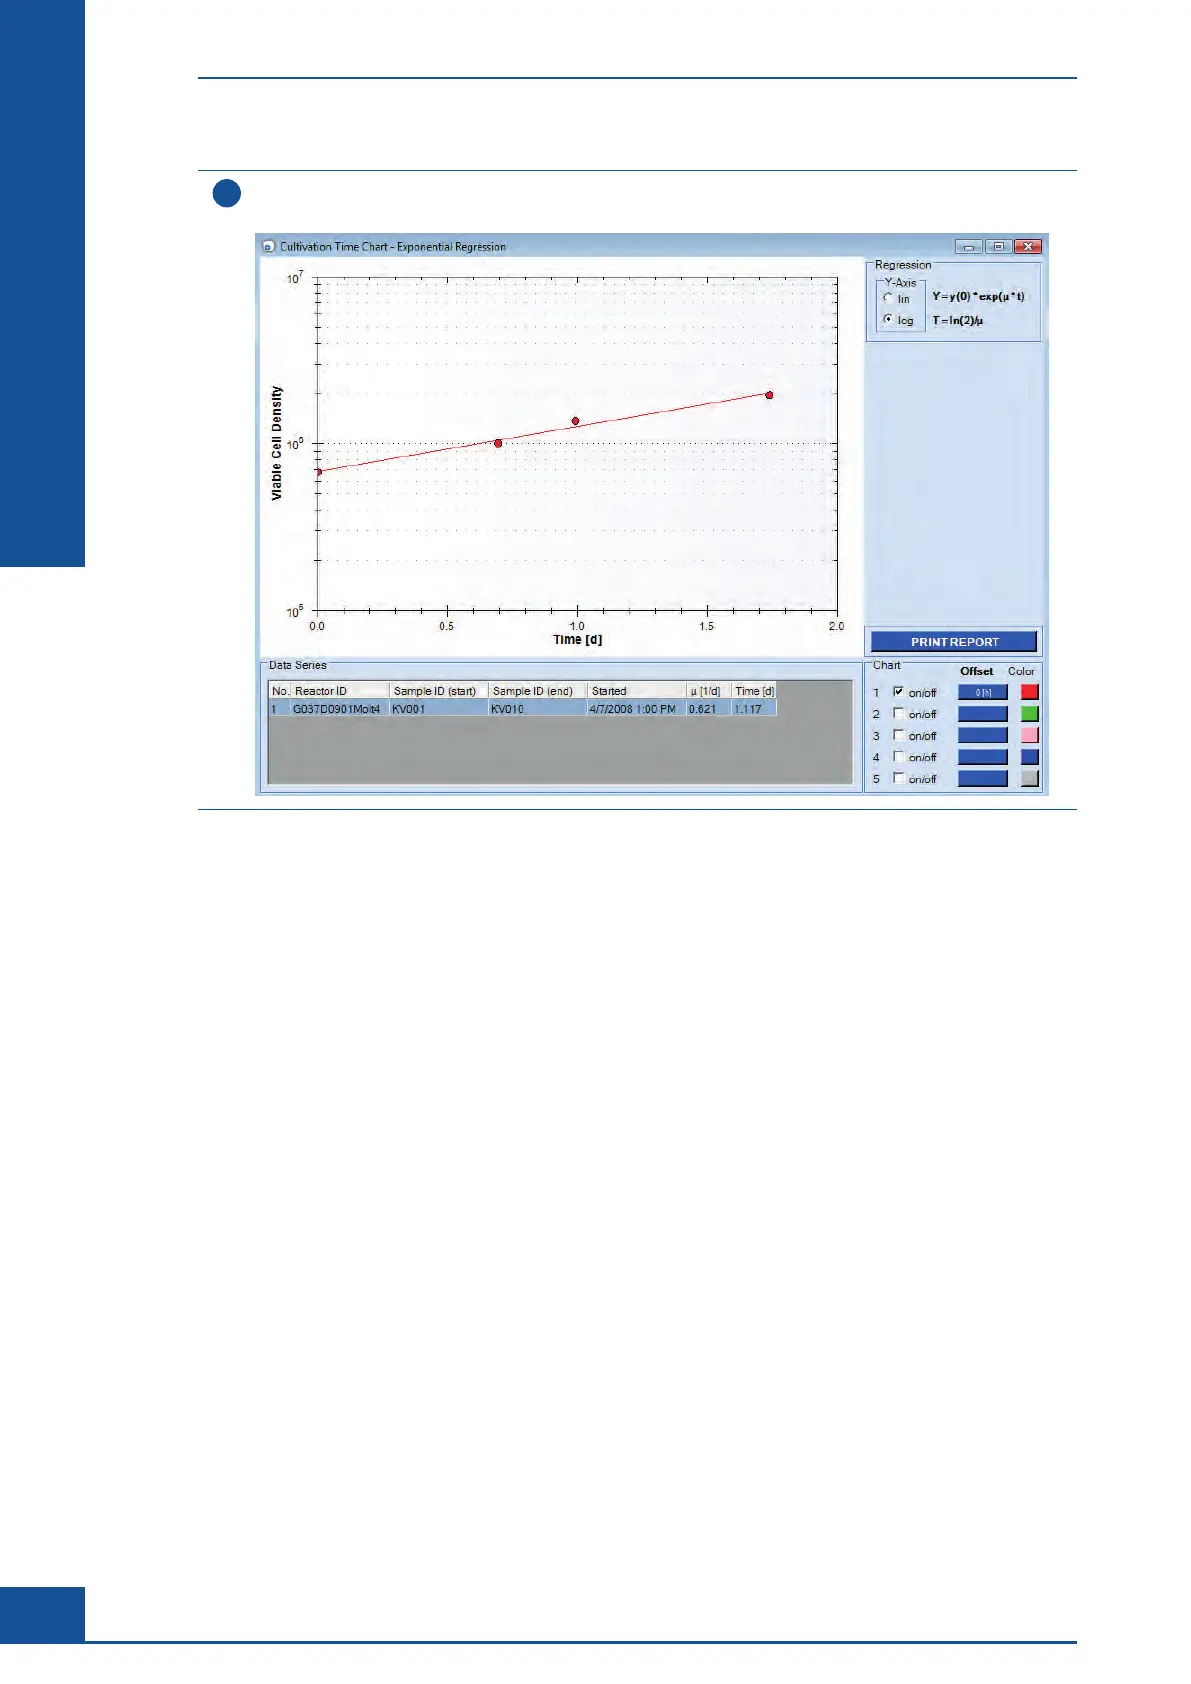
In the CTC Views dialog box, click on the EXPONENTIAL REGRESSION button.
The Cultivation Time Chart – Exponential Regression dialog box is displayed:
n
The Cedex HiRes Software performs an automatic calculation of the specific growth rate and doubling time
based on the viable cell concentration results from the measurements actively included in the chart.
The graph only shows the viable cell concentration. The measurement parameters specific growth rate μ [1/d]
and doubling time Time [d] of the culture are computed by means of the differential curve and shown in the
Data Series area at the bottom of the Exponential Regression chart.
Monitoring Growth of Cells Over Time
Result Analysis