130
Cedex HiRes Analyzer Operator’s Guide
D
D
12.3 Tracking Trends in SST Results Over Time
The results of SST checkpoints can be tracked over time using the SST TRENDING button. Trends for both
checkpoints with and without measurements can be tracked.
12.3.1. Tracking Trends in SST Checkpoints With Measurements
To see all of the results over time from a particular SST checkpoint with measurements, do the following:
1
Select the SST checkpoint to be monitored by clicking on the field to the left of the appropriate line.
2
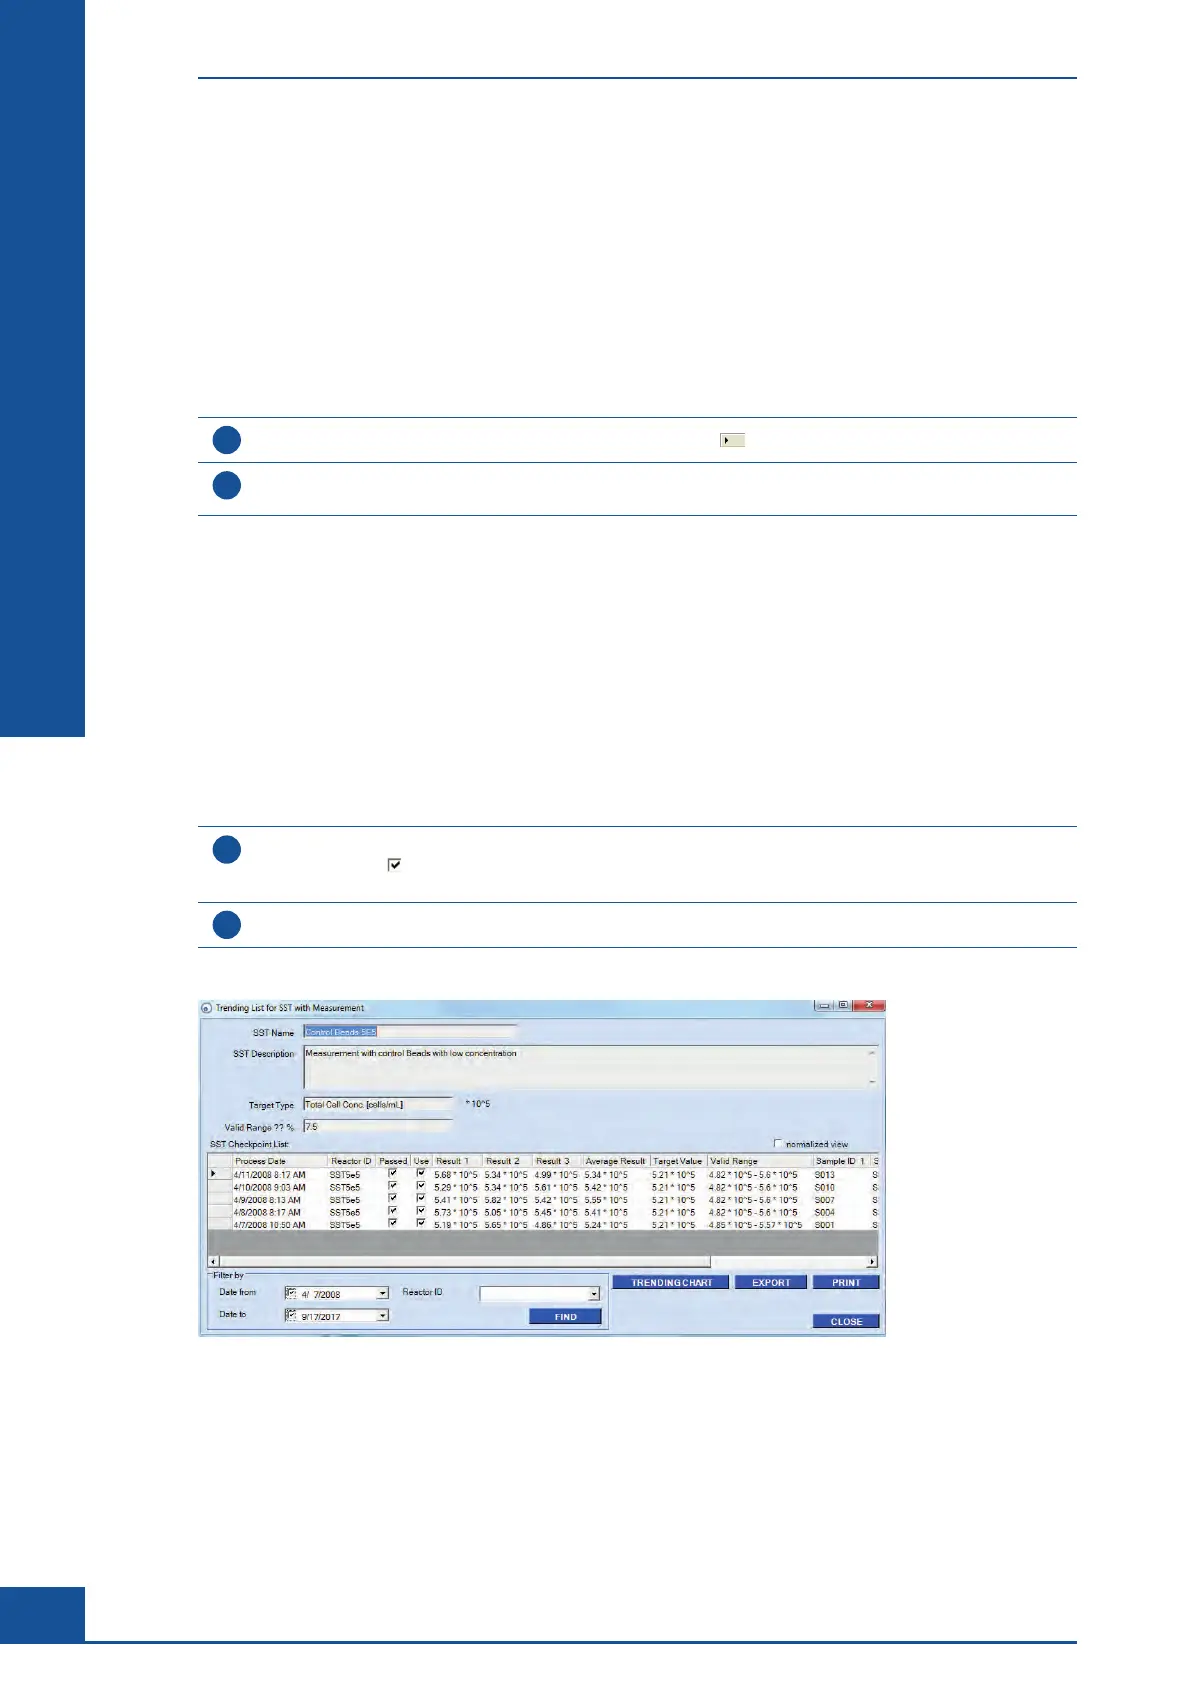
Click on the SST TRENDING button to open the Trending List for SST with Measurement dialog box
(see Figure 44).
■
All of the measurements for the selected SST checkpoint are listed in this dialog box. The Filter by area in the
bottom left-hand corner can also be used to search for and list specific measurements based on date run and
Reactor ID. The information in the Trending List for SST with Measurement dialog box can be exported via the
EXPORT button or printed via the PRINT button
The SST checkpoint results are displayed in the result column in the units of the Overall Type selected for that
particularly SST checkpoint. Clicking on the normalized view checkbox will normalize the results to the target
value and display the differences in percent.
To create a chart showing result trends over time, do the following:
1
Click on the Use checkbox to mark the measurements that should be included in the calculations for the
trending chart. A
indicates that the measurement will be used. All measurements will be included on the
Trending Chart, but excluded measurements will be circled in red and not used for curve calculations.
2
Click on the TRENDING CHART button to create a Trending Chart.
■
Figure 44: Trending List for SST with Measurement dialog box
The System Suitability Test (SST)
Tracking Trends in SST Results Over Time