Spectrum Measurements
R&S
®
ESR
310User Manual 1175.7068.02 ─ 12
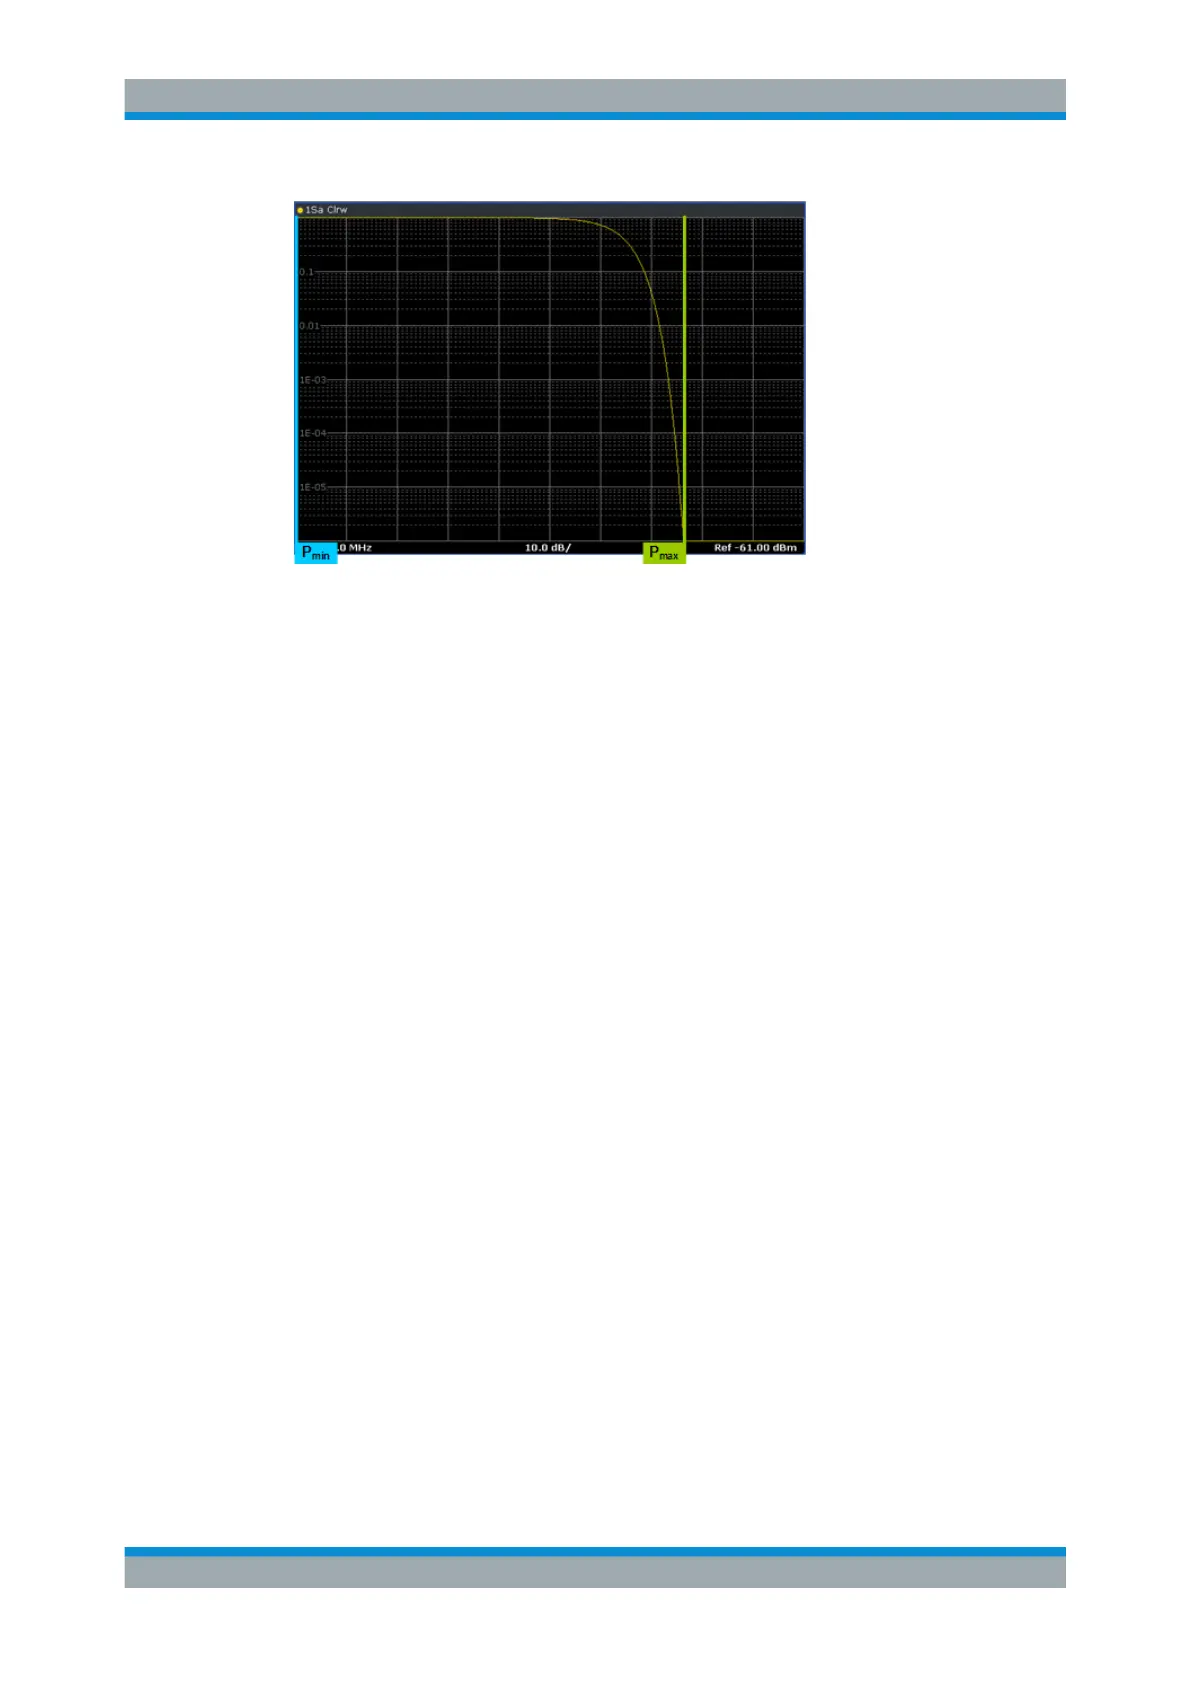
APD of a pulse signal
The following example shows the APD of a pulse signal. The pulse period is 100 ms
and the pulse width is 1 ms, so the pulse is transmitted within 1 % of the time.
The example is based on the following configuration.
Center frequency 200 MHz
Span Zero span (0 Hz)
Unit dBm
Reference Level -10 dBm
Attenuation 20 dB
RBW 1 MHz (EMI)
VBW 10 MHz
Sweep time 100 ms
Detector Auto Peak
All other settings are in their default (preset) state.
Again, the first picture shows the resulting signal characteristics in the time domain
(zero span). The x-axis shows the time. The y-axis shows the level of the signal. P
max
is the highest level that has been measured, P
min
is the lowest level (not shown com-
pletely).
Measurements

 Loading...

