Spectrum Measurements
R&S
®
ESR
433User Manual 1175.7068.02 ─ 12
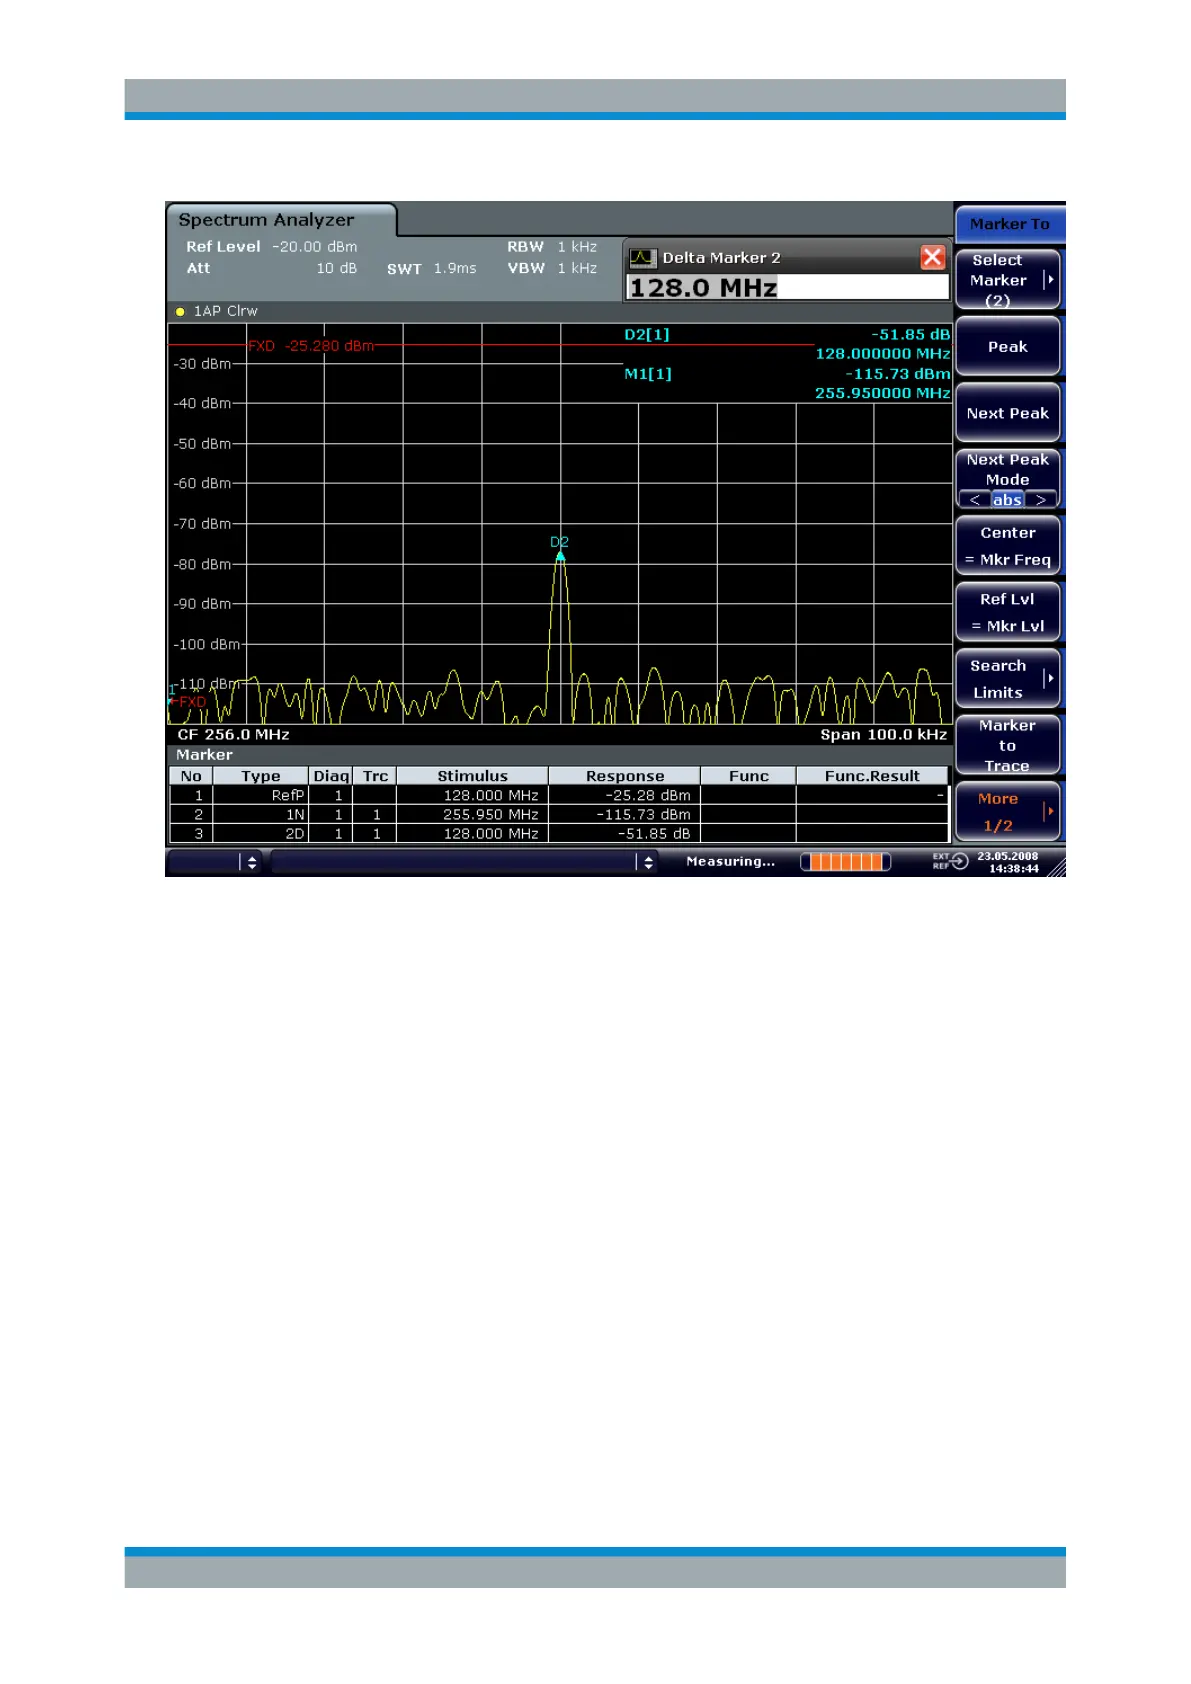
Figure 6-23: Measuring the level difference between the fundamental wave (= reference point level)
and the 2nd harmonic
The other harmonics are measured with steps 5 and 6, the center frequency being
incremented or decremented in steps of 128 MHz using the [UPARROW] or
[DNARROW] key.
6.4.3 Measuring the Spectra of Complex Signals
6.4.3.1 Separating Signals by Selecting an Appropriate Resolution Bandwidth
A basic feature of a signal analyzer is being able to separate the spectral components
of a mixture of signals. The resolution at which the individual components can be sepa-
rated is determined by the resolution bandwidth. Selecting a resolution bandwidth that
is too large may make it impossible to distinguish between spectral components, i.e.
they are displayed as a single component.
An RF sinusoidal signal is displayed by means of the passband characteristic of the
resolution filter (RBW) that has been set. Its specified bandwidth is the 3 dB bandwidth
of the filter.
Advanced Measurement Examples

 Loading...

