Spectrum Measurements
R&S
®
ESR
269User Manual 1175.7068.02 ─ 12
Label Description
Range Up Frequency range stop for range the peak value belongs to
RBW RBW of the range
Frequency Frequency
Power Abs Absolute power level
Power Rel Power level relative to the TX channel power
ΔLimit Deviation of the power level from the defined limit
In which detail the data is displayed in the result table can be defined in the List Evalu-
ation menu. By default, one peak per range is displayed. However, you can change the
settings to display only peaks that exceed a threshold ("Margin").
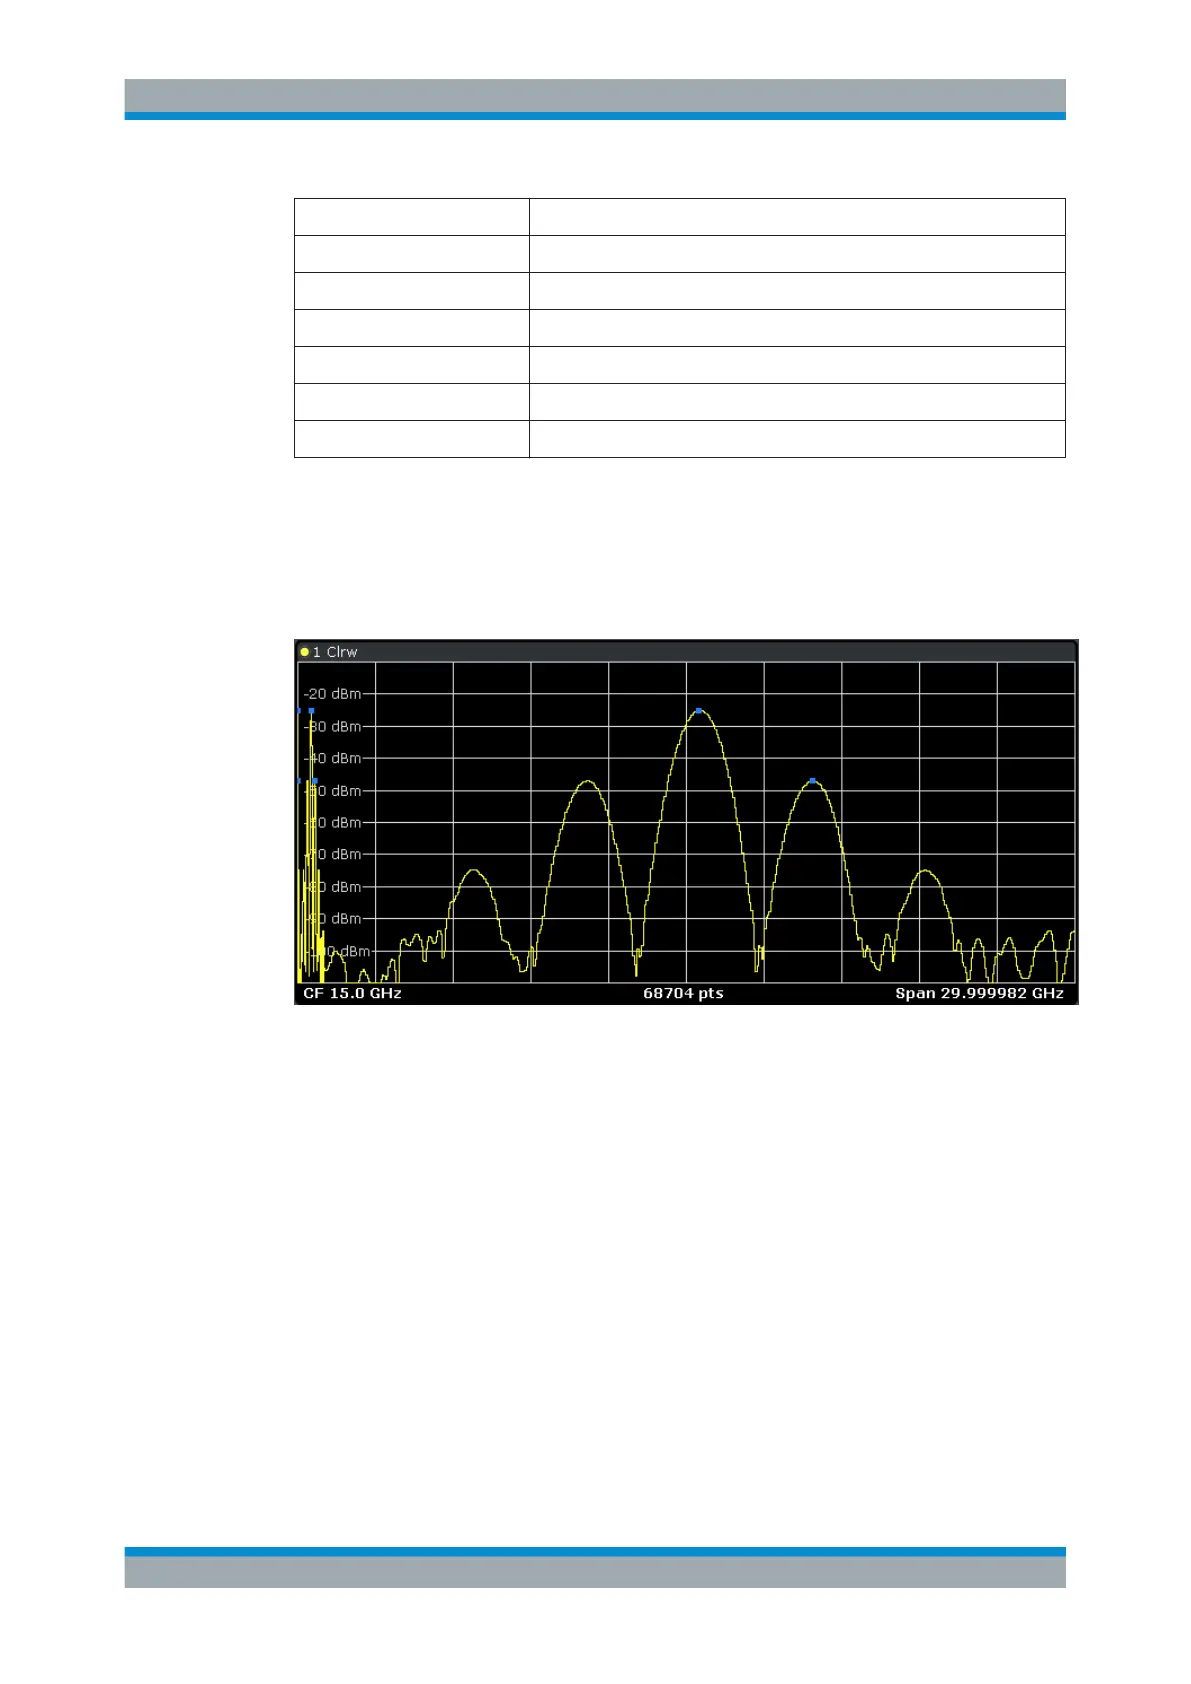
In addition to listing the peaks in the list evaluation, detected peaks can be indicated by
blue squares in the diagram ("Show Peaks").
Furthermore, you can save the evaluation list to a file ("Save Evaluation List").
Retrieving Results via Remote Control
The measurement results of the spectrum emission mask test can be retrieved using
the CALCulate<n>:LIMit<k>:FAIL? command from a remote computer.
The power result for the reference range can be queried using
CALC:MARK:FUNC:POW:RES? CPOW, the peak power for the reference range using
CALC:MARK:FUNC:POW:RES? PPOW.
For details see CALCulate<n>:MARKer<m>:FUNCtion:POWer:RESult?
on page 721.
Ranges and Range Settings
In the Spectrum Emission Mask measurements, a range defines a segment for which
you can define the following parameters separately:
●
Start and stop frequency
Measurements
 Loading...