Quick Start
R&S
®
ESR
116User Manual 1175.7068.02 ─ 12
c) Press the "Trg/Gate Level" softkey and enter 50%.
A static image for the FM AF signal is produced.
Result: (-10 ( 5) dB; this yields a deviation of 100 kHz when the steepness of
the demodulator characteristic is 5 dB/100 kHz.
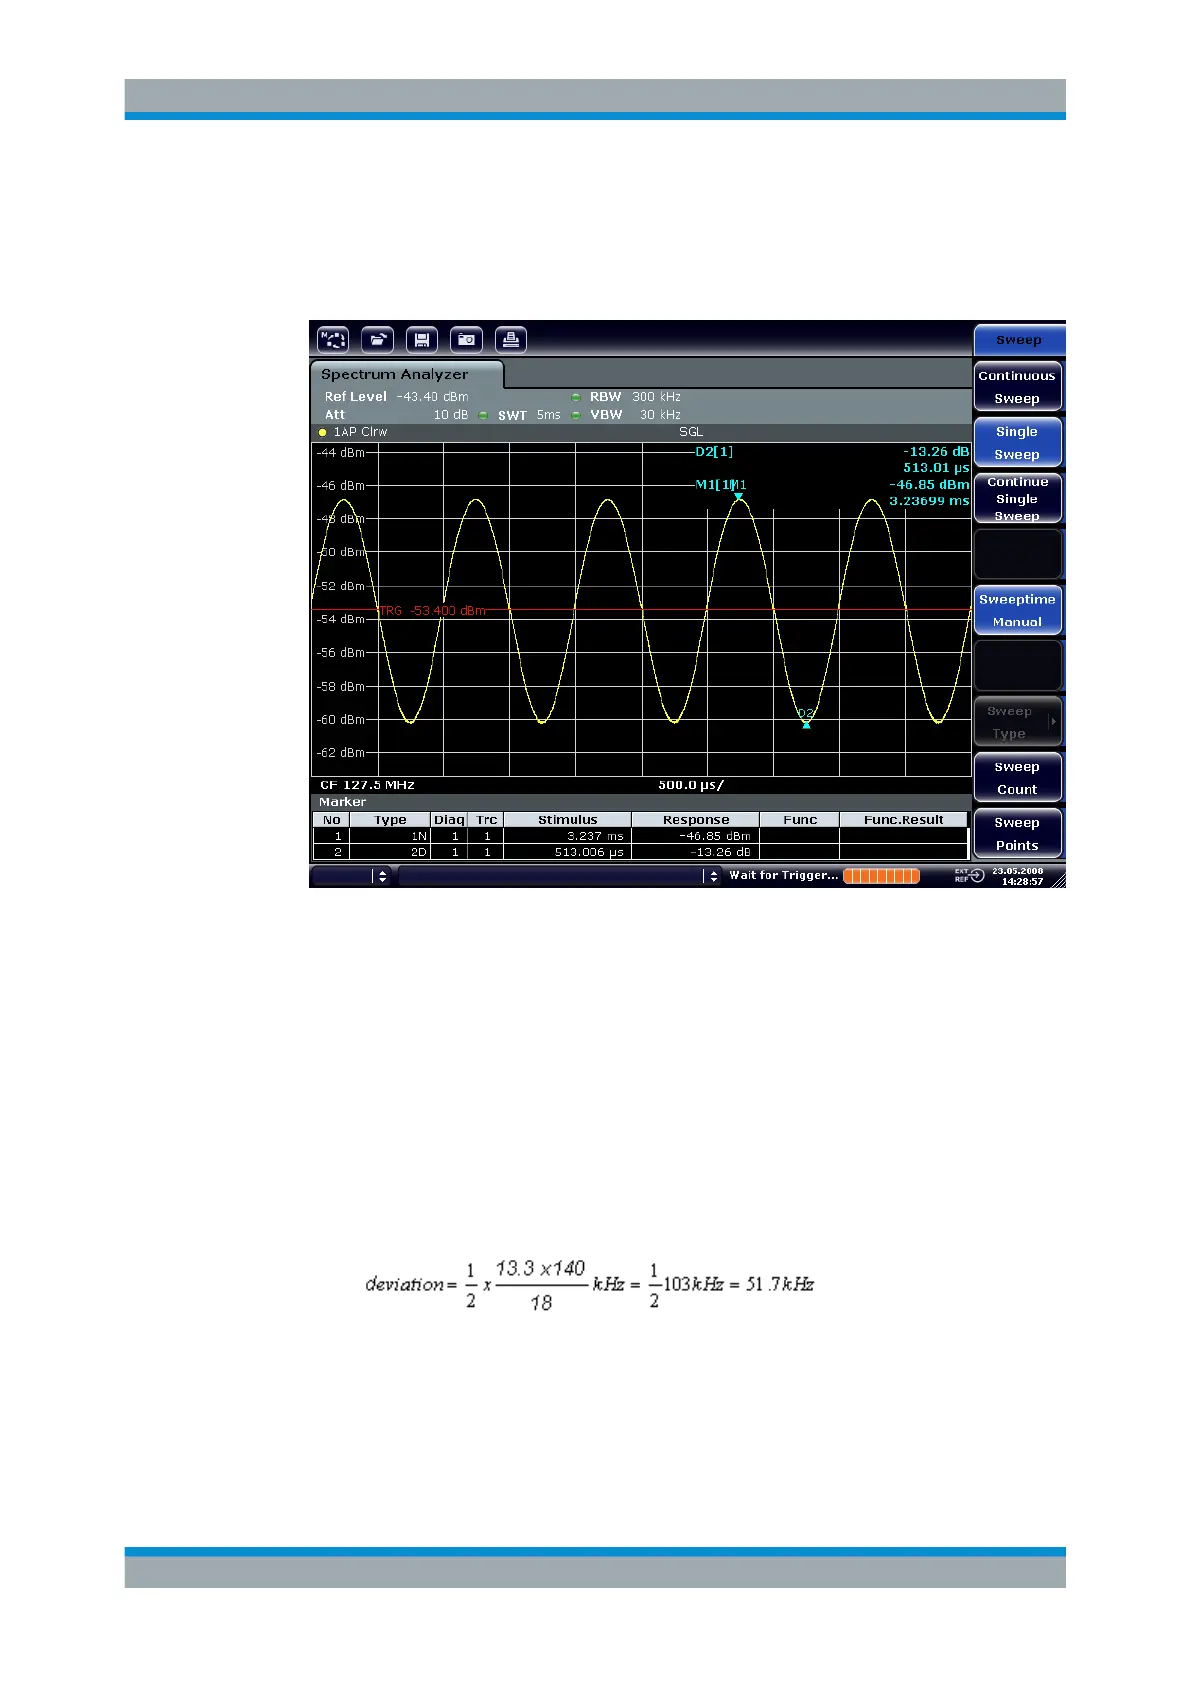
Figure 3-21: Demodulated FM signal
9. Determine the deviation.
a) Press the [MKR] key.
Marker 1 is activated and placed on the peak of the curve.
b) Press the "Marker 2" softkey.
c) Press the [MKR] key.
d) Press the "More" softkey.
e) Press the "Min" softkey.
Marker 2 (delta marker) is placed on the minimum of the curve. The level differ-
ence is 13.3 dB, which corresponds to the peak-to-peak deviation. With the fil-
ter slope of 18 dB/140 kHz, the deviation can be calculated as follows:
3.5.5 Storing and Loading Instrument Settings
The R&S ESR can store complete instrument settings together with instrument config-
urations and measurement data in a settings file. The data is stored on the built-in hard
Basic Measurement Examples
 Loading...