2-30
IM DLM6054-01EN
The following formulas are used to calculate each item.
Vtop – Vbase
T crossing 2 – T crossing 1
Crossing% = 100
Duty Cycle Distortion% = 100
Eye height = (Vtop – 3
σ
top) – (Vbase + 3
σ
base)
Eye width = (T crossing 2 – 3
σ
crossing 2) – (T crossing 1 + 3
σ
crossing 1)
Jitter =
σ
crossing 1
Jitter2 =
σ
crossing 2
QFactor =
ExtRatedB =10 log
Vtop – Vbase
Trising 50% – Tfalling 50%
σ
top +
σ
base
Vtop – Vdark
section 10.4 for the procedure
You can observe the correlation between two input signal levels by displaying one signal level on the
X-axis (horizontal axis) and a second signal level on the Y-axis (vertical axis). You can display X-Y
waveforms at the same time as normal T-Y (time and level) waveforms.
It is also possible to specify the ranges for X-Y analysis and to perform analysis according to the level
of the specified signal.
You can use cursors to measure the X-Y analysis results. You can also compute the area of the X-Y
waveform. For information about how the area of the X-Y waveform is computed, see Appendix 1, “How
Waveform Areas Are Calculated.
”
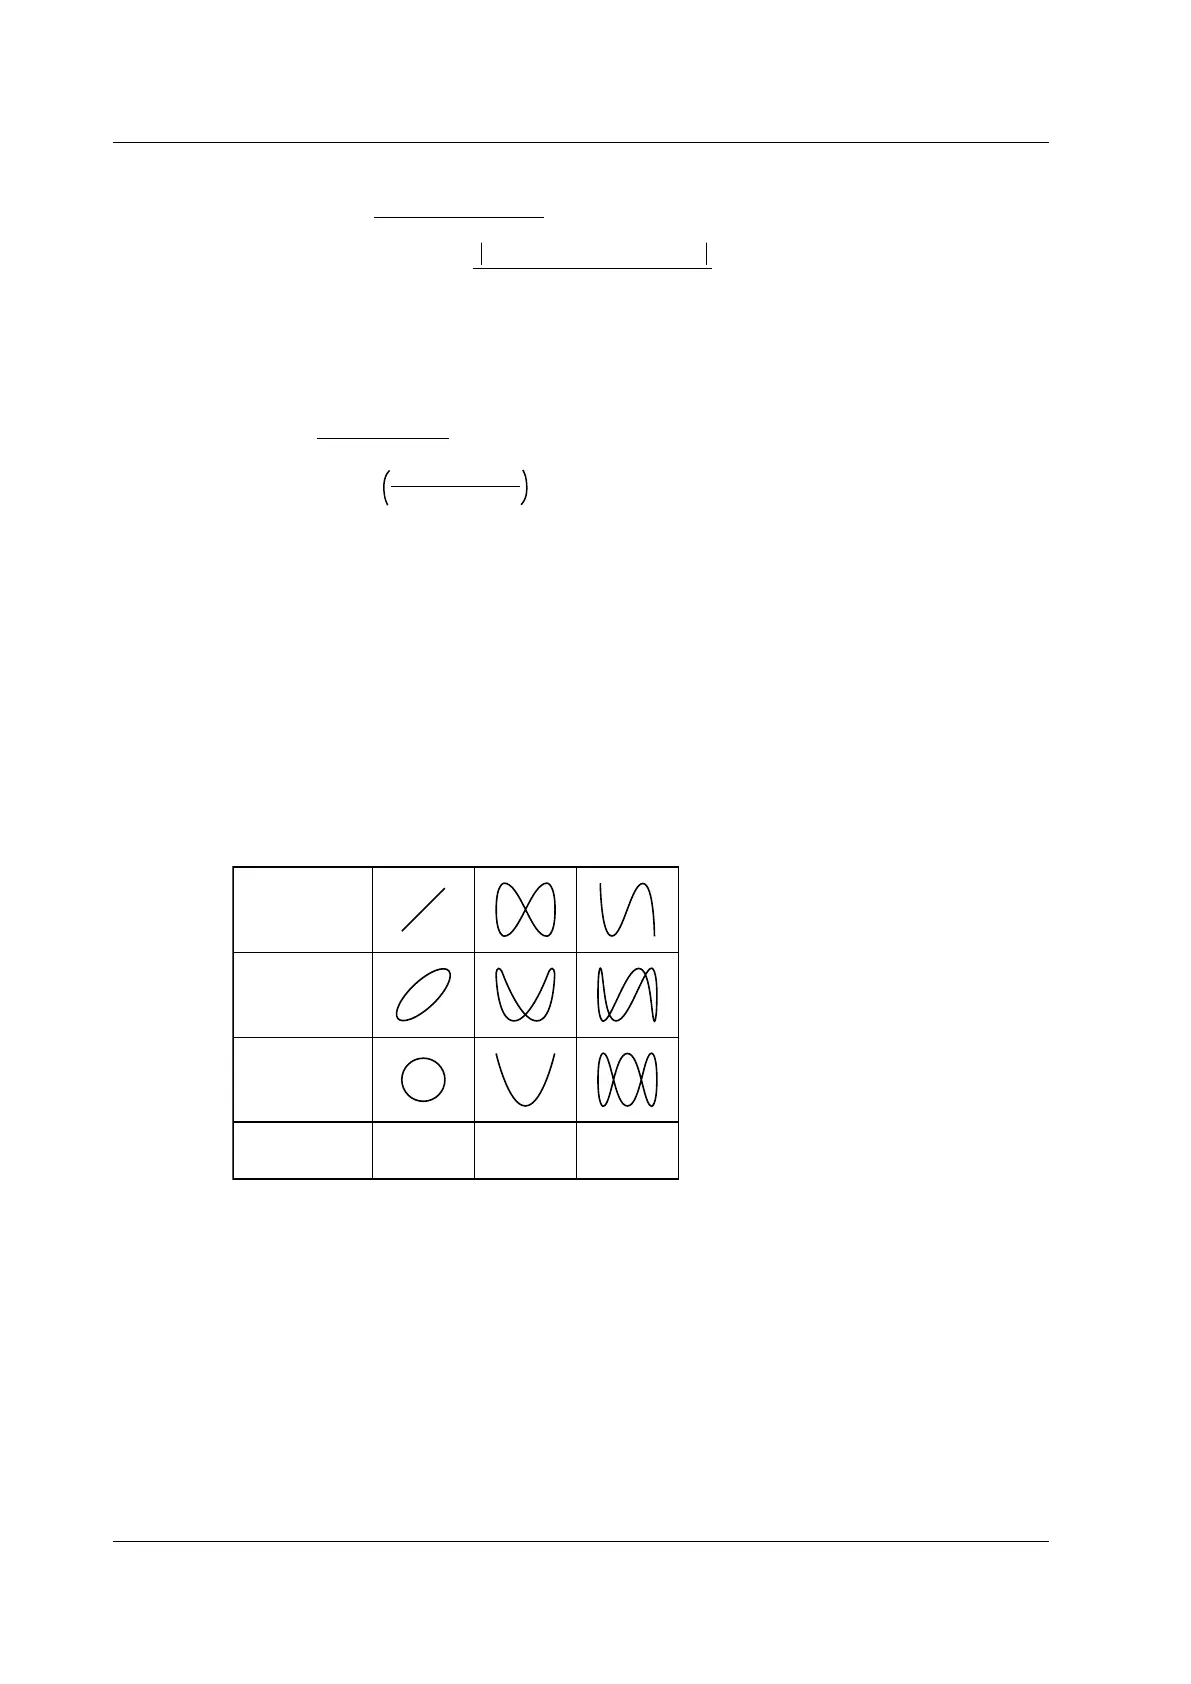
You can use the X-Y waveform display to measure the phase angle between two sine wave signals. An
X-Y display of two sine waves produces a Lissajous curve, from which the phase angle can be read.
0° phase angle
45° phase angle
90° phase angle
Frequency ratio
(X:Y)
1:1 1:2 1:3
2.8 Analysis and Searching
 Loading...