To display a Nyquist diagram.
1 Measure the open loop response.
2 Press [
Disp Format
][
SINGLE
].
3 Press [
Trace Coord
][
MORE CHOICES
][
NYQUIST DIAGRAM
].
4 Press [
Scale
].
Press [
AUTOSCALE ON OFF
] to highlight ON.
5 Press [
AXES SCALE MARKERS
].
Press [
AXIS X Y
] to highlight Y.
Press [
MOVE CENTER
].
Using the knob move the axes scale markers close to the -1 + j0 X-axis location.
Press [
CHANGE WIDTH
].
Using the knob widen the scale markers to include the -1 + j0 Y-axis location.
Press [
SCALE AT MARKERS
].
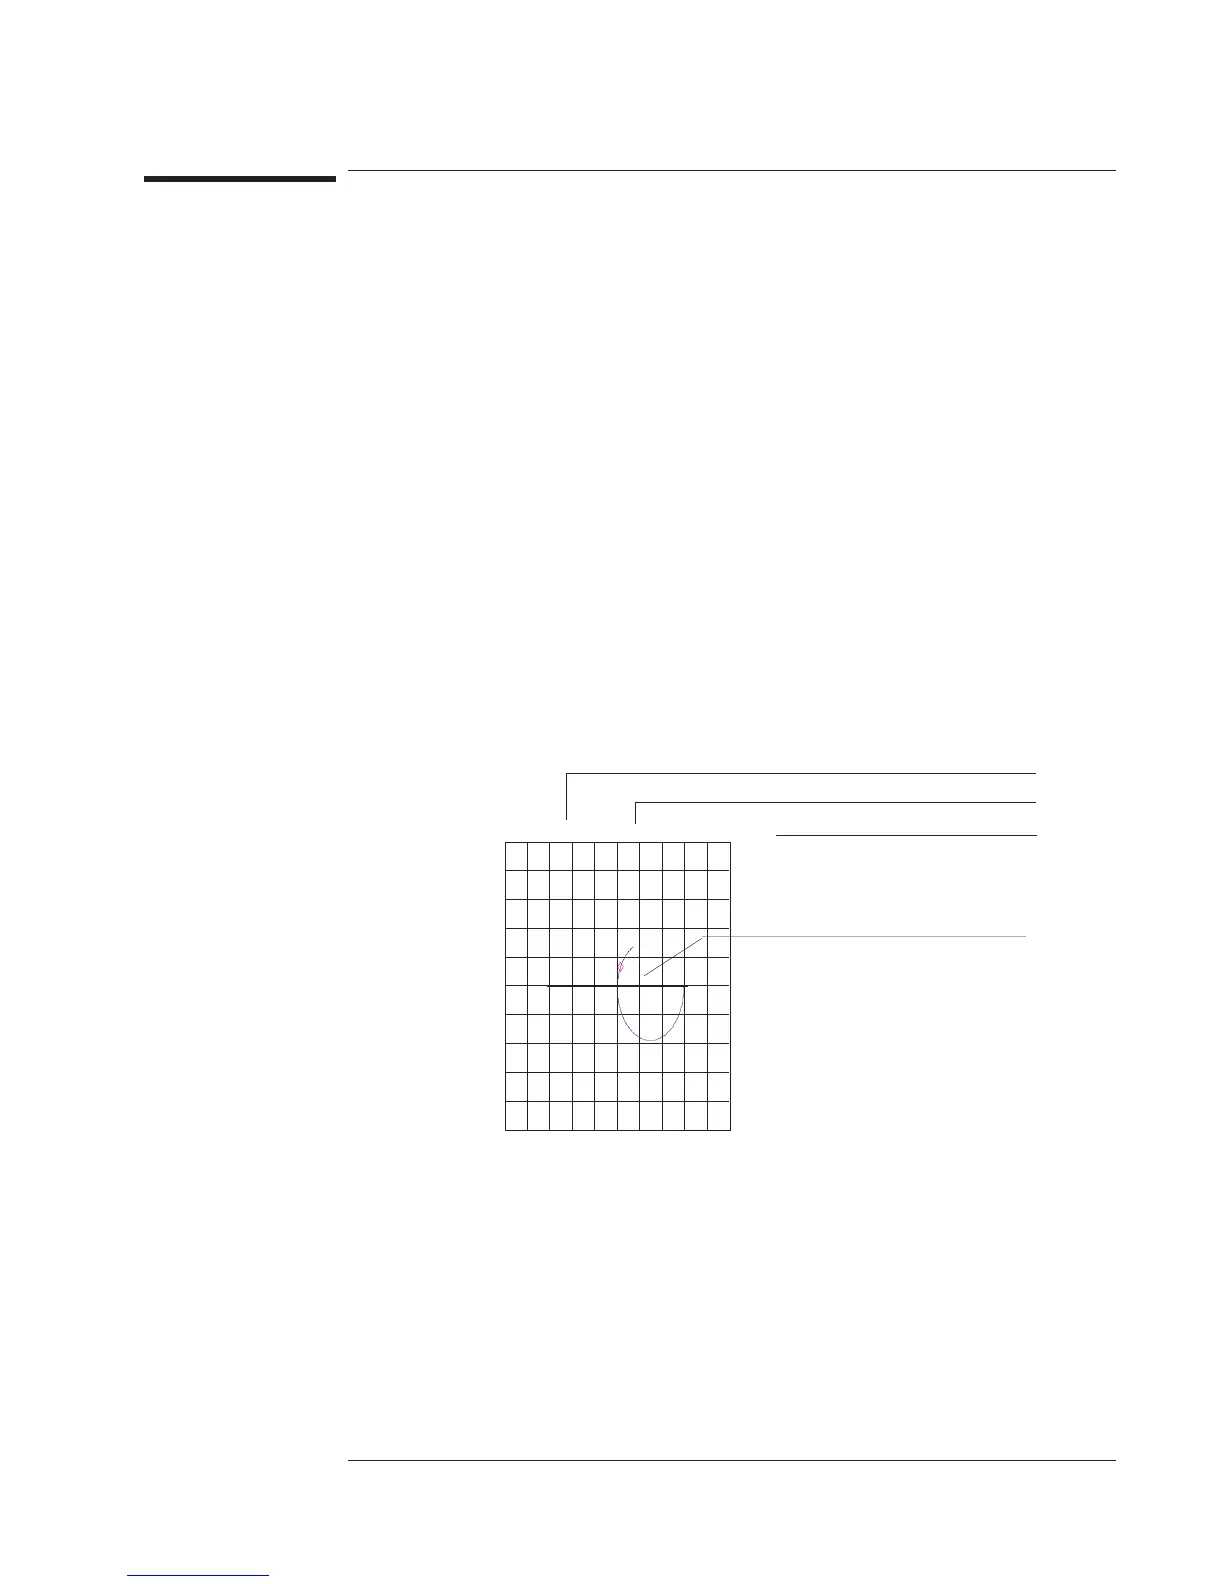
Stability criteria requires that the open loop response can only cross the negative real
axis between the origin and -1 + j0. Crossing anywhere else dictates the loop is
conditionally stable or unstable.
+j
-j
+1-1
A: FreqResp2/1 X:7.424 kHzR:46.777e-3 I:169.18 e-3
-
1.25
-1.25
Imag
Nyquist
250
e-3
/div
Disk Util DefDisk: Internal
Frequency Value
Real Value
Imaginary Value
Origin
0,0
Agilent 35670A
Operator's Guide Measuring Control Systems
5-17