To compare a frequency response measurement to synthesized
results
1 Transfer the curve fit table to a synthesis table. See the previous task.
2 Press [
Disp Format
][
UPPER/LOWER
].
3 Press [
Active Trace
][
A
]
Press [
Meas Data
][
FREQUENCY RESPONSE
].
4 Press [
Active Trace
][
B
].
5 Press [
Analys
][
SYNTHESIS
][
START SYNTHESIS
].
6 Press [
Scale
][
MATCHXSCALE
][
TO TRACE A
].
7 To overlay the results,
press [
Disp Format
][
SINGLE FRNT/BACK
].
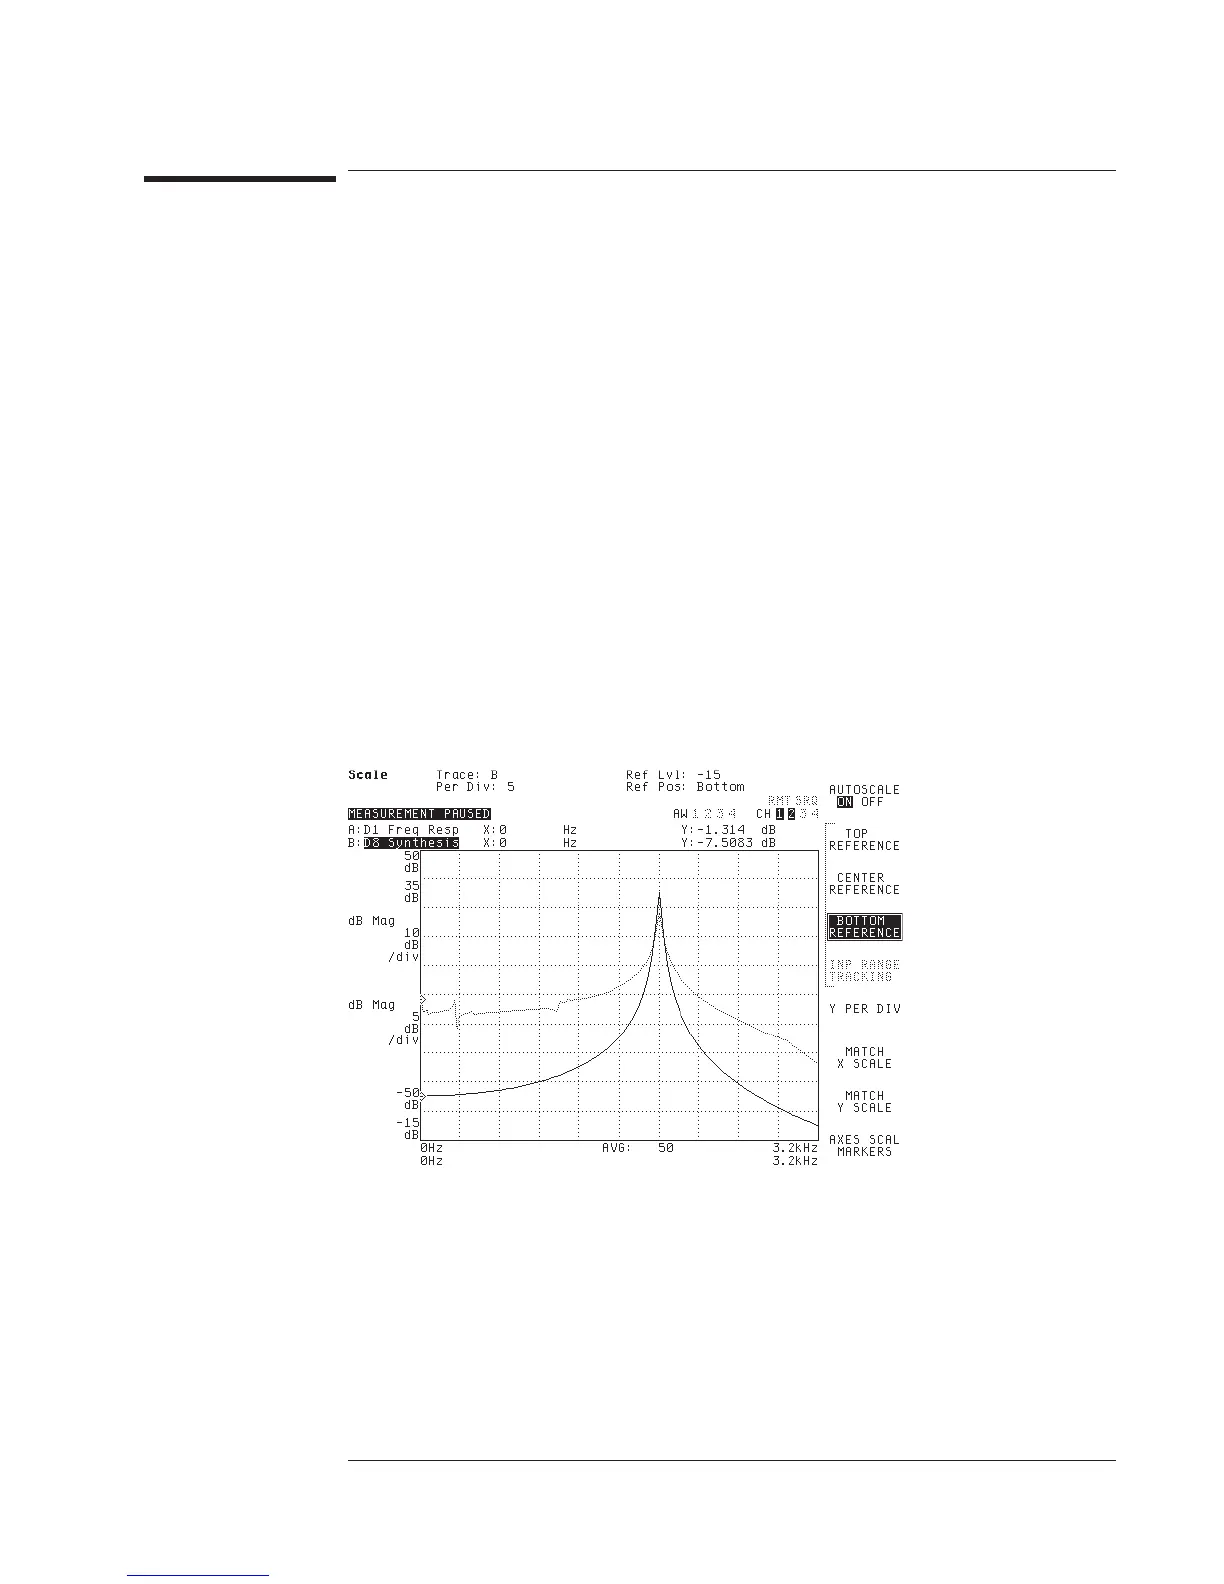
The analyzer puts the synthesized frequency response on the active trace. To keep the
original measurement data on Trace A, put the synthesized data on Trace B.
If you overlay the results in step 3, the vertical scaling for trace B is automatically set
to match trace A.
Agilent 35607A
Operator's Guide Curve Fit Option 1D3
16-39