To display the waterfall buffer
1 Set up a waterfall display as described earlier in this chapter.
2 If the analyzer is measuring, press [
Pause/Cont
]topauseit.
3 Press [
Meas Data
], then press the softkey corresponding to the measurement results
you want to examine.
4 Press [
Marker Fctn
][
WATERFALL MARKERS
].
5 If you want to examine older portions of the buffer, press [
SCROLL DOWN
].
The nature of a waterfall display is somewhat different when the analyzer is measuring
than when it is paused. When the analyzer is measuring, the waterfall display provides
a visual record of the last N measurements—where N is determined by the setting of
[
Z-AXIS RANGE
]. This visual record is cleared each time you rescale the X-, Y-, or
Z-axis or change the waterfall skew angle or trace height. In addition, you can only
analyze the record by estimating a particular feature’s position on the screen.
When the analyzer is paused, the waterfall display can be used to display the contents
of the waterfall buffer. The buffer stores the results of the last M
measurements—where M is determined by the setting of [
WATERFALL STEPS
]. You
can display the buffer in N-sized chunks and analyze its contents more precisely by
turning on the waterfall markers.
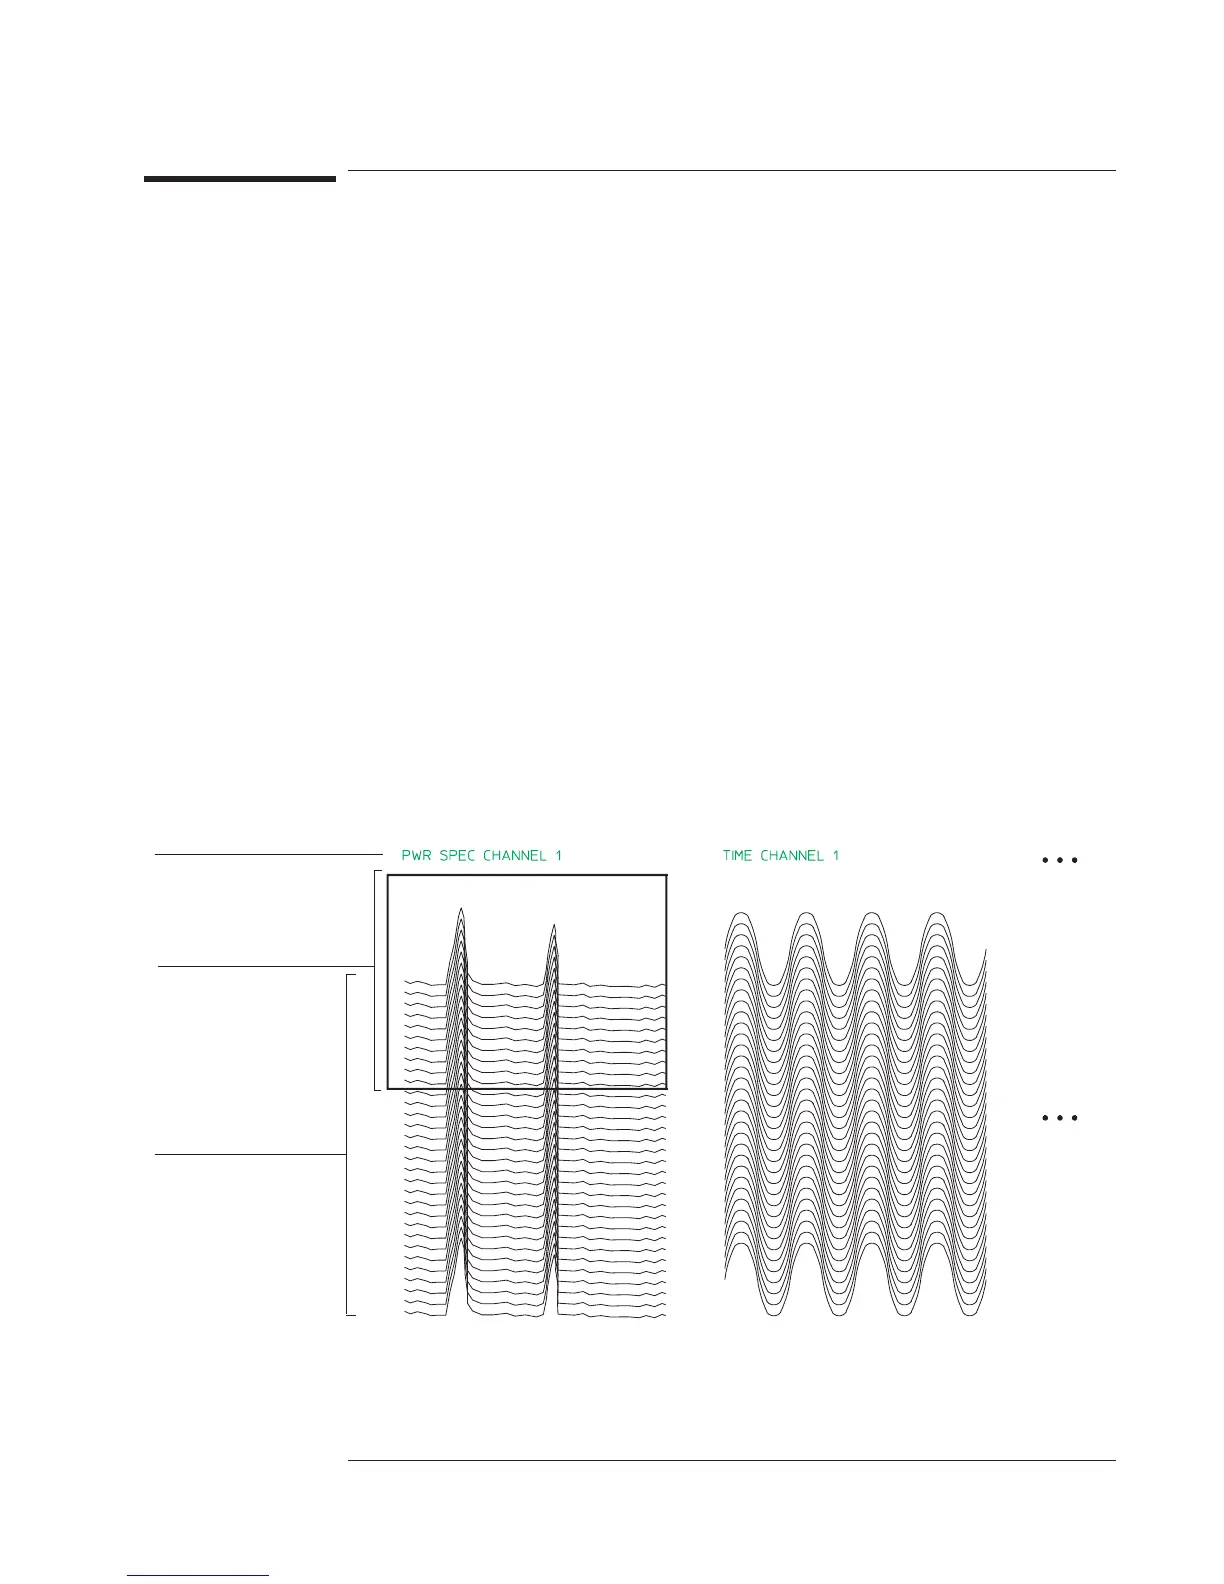
Waterfall buffer contains all
measurement data.
[ Z-AXIS RANGE ] determines
how many traces you see on
the display.
[ WATERFALL STEPS ]
determines how many
measurements you store in the
waterfall buffer.
Agilent 35670A
Operator's Guide Formatting the Display
9-9