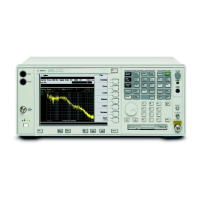
To synthesize a frequency response curve
The analyzer plots the synthesized frequency response data on the active traces. In
this task, the magnitude is displayed on trace A and the phase is displayed on trace B.
The analyzer must be in FFT Analysis or Swept Sine instrument modes.
1 Create and display a synthesis table.
See the previous task, “To create a synthesis table.”
Press [
TABLE ON OFF
] to highlight OFF.
2 Set up the active traces.
Press [
Active Trace
][
AB
].
Press [
Meas Data
], [
MORE CHOICES
], [
DATA REGISTER
], [
D8
].
3 Specify the measurement frequency span.
Press [
Freq
][
START
] <number> <unit>, then press [
STOP
] <number> <unit>.
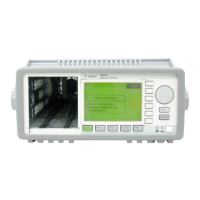
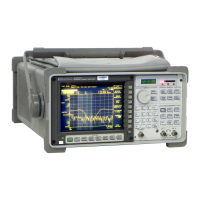
Agilent 35670A
Synthesis Option 1D3 Operator's Guide
15-26
 Loading...


