4 Configure the display.
Press [
Active Trace
][
B
].
Press [
Trace Coord
][
PHASE
].
Press [
Active Trace
][
AB
].
Press [
Scale
], then press[
AUTOSCALE ON OFF
] to highlight ON.
5 Start the synthesis.
Press [
Analys
][
SYNTHESIS
][
START SY NTHESIS
].
You can also recall a previously saved synthesis table or transfer a curve fit table in
Step 1.
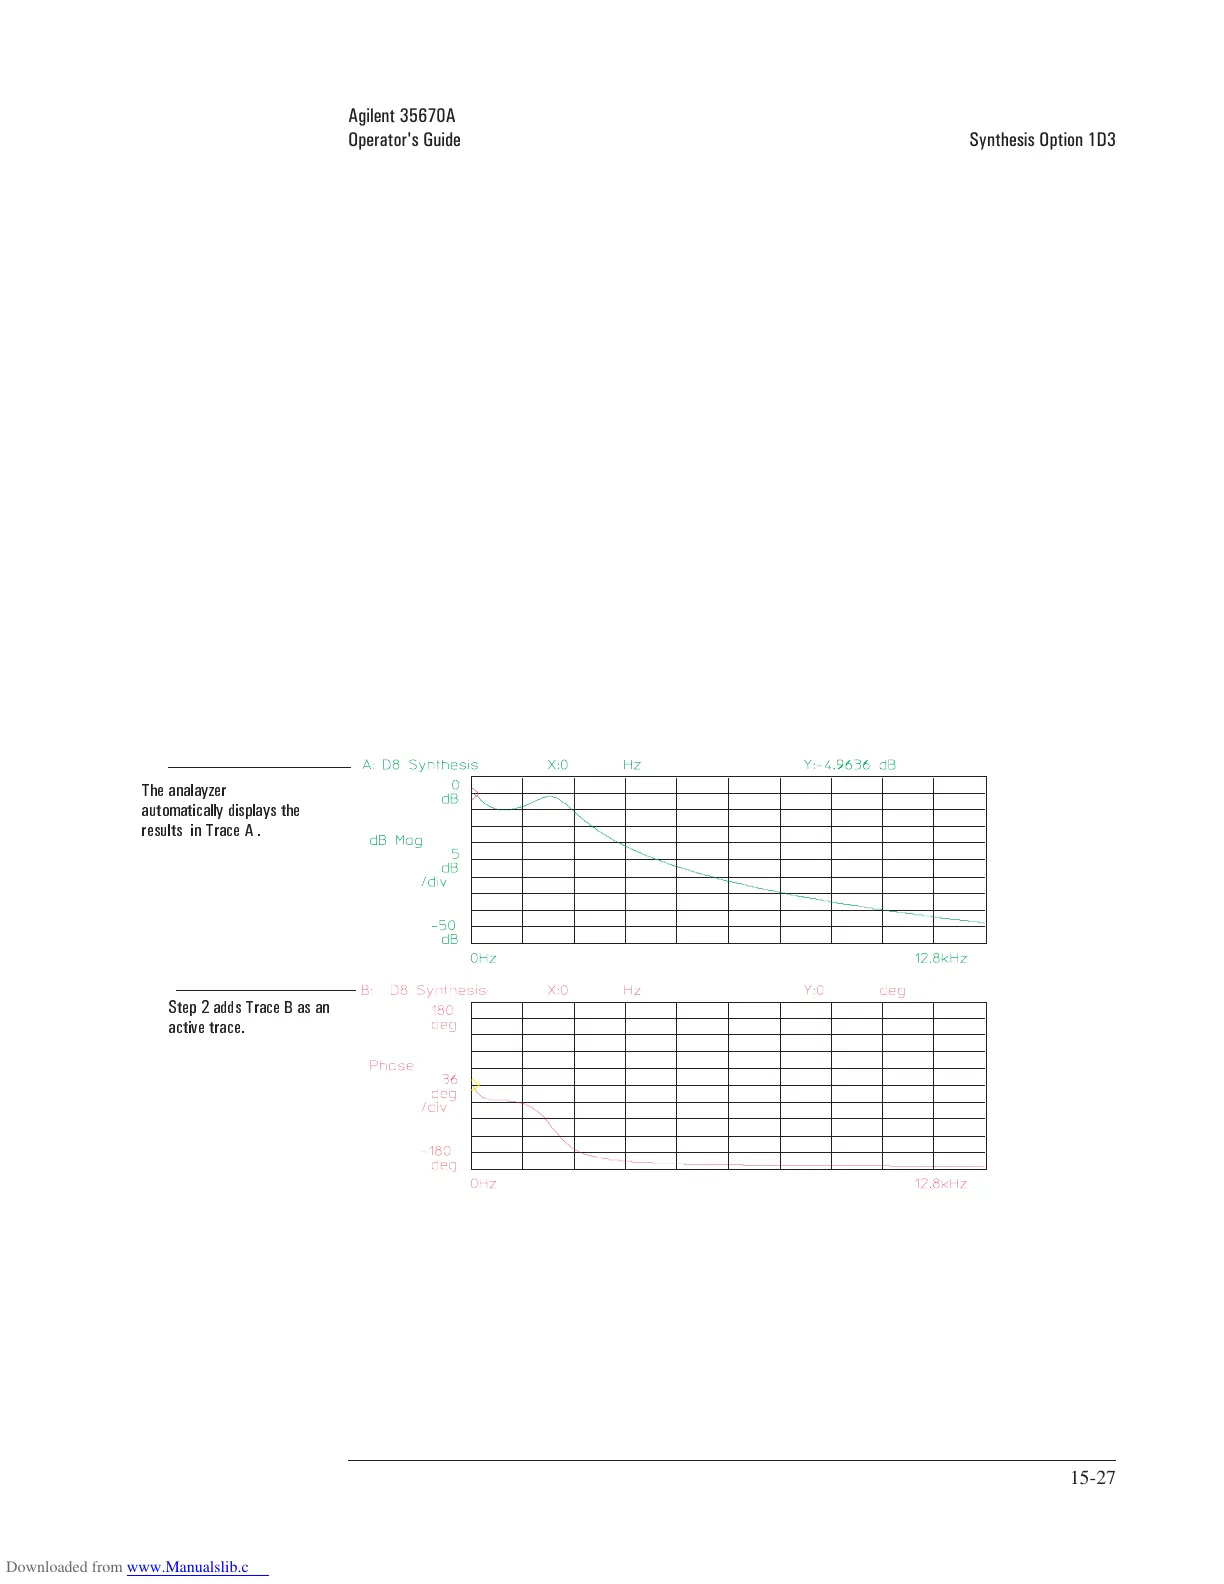
The analyzer stores the results of the synthesis in the selected data register, D8, and
automatically displays it in the active trace. Trace A is the default. Step 2 adds Trace
B as an active trace and specifies the data in D8.
If you do not set the start and stop frequencies in step 3, the analyzer uses the
frequency-span set up for measurements. Once you set the start and stop frequencies,
you do not have to set them for subsequent synthesis calculations.
To change the synthesis data spacing for the X-axis, see the next task.
Step 2 adds Trace B as an
active trace.
The analayzer
automatically displays the
results in Trace A .
Agilent 35670A
Operator's Guide Synthesis Option 1D3
15-27