Chapter 15 501
Measurement Examples
Evaluating a Duplexer
15. Measurement Examples
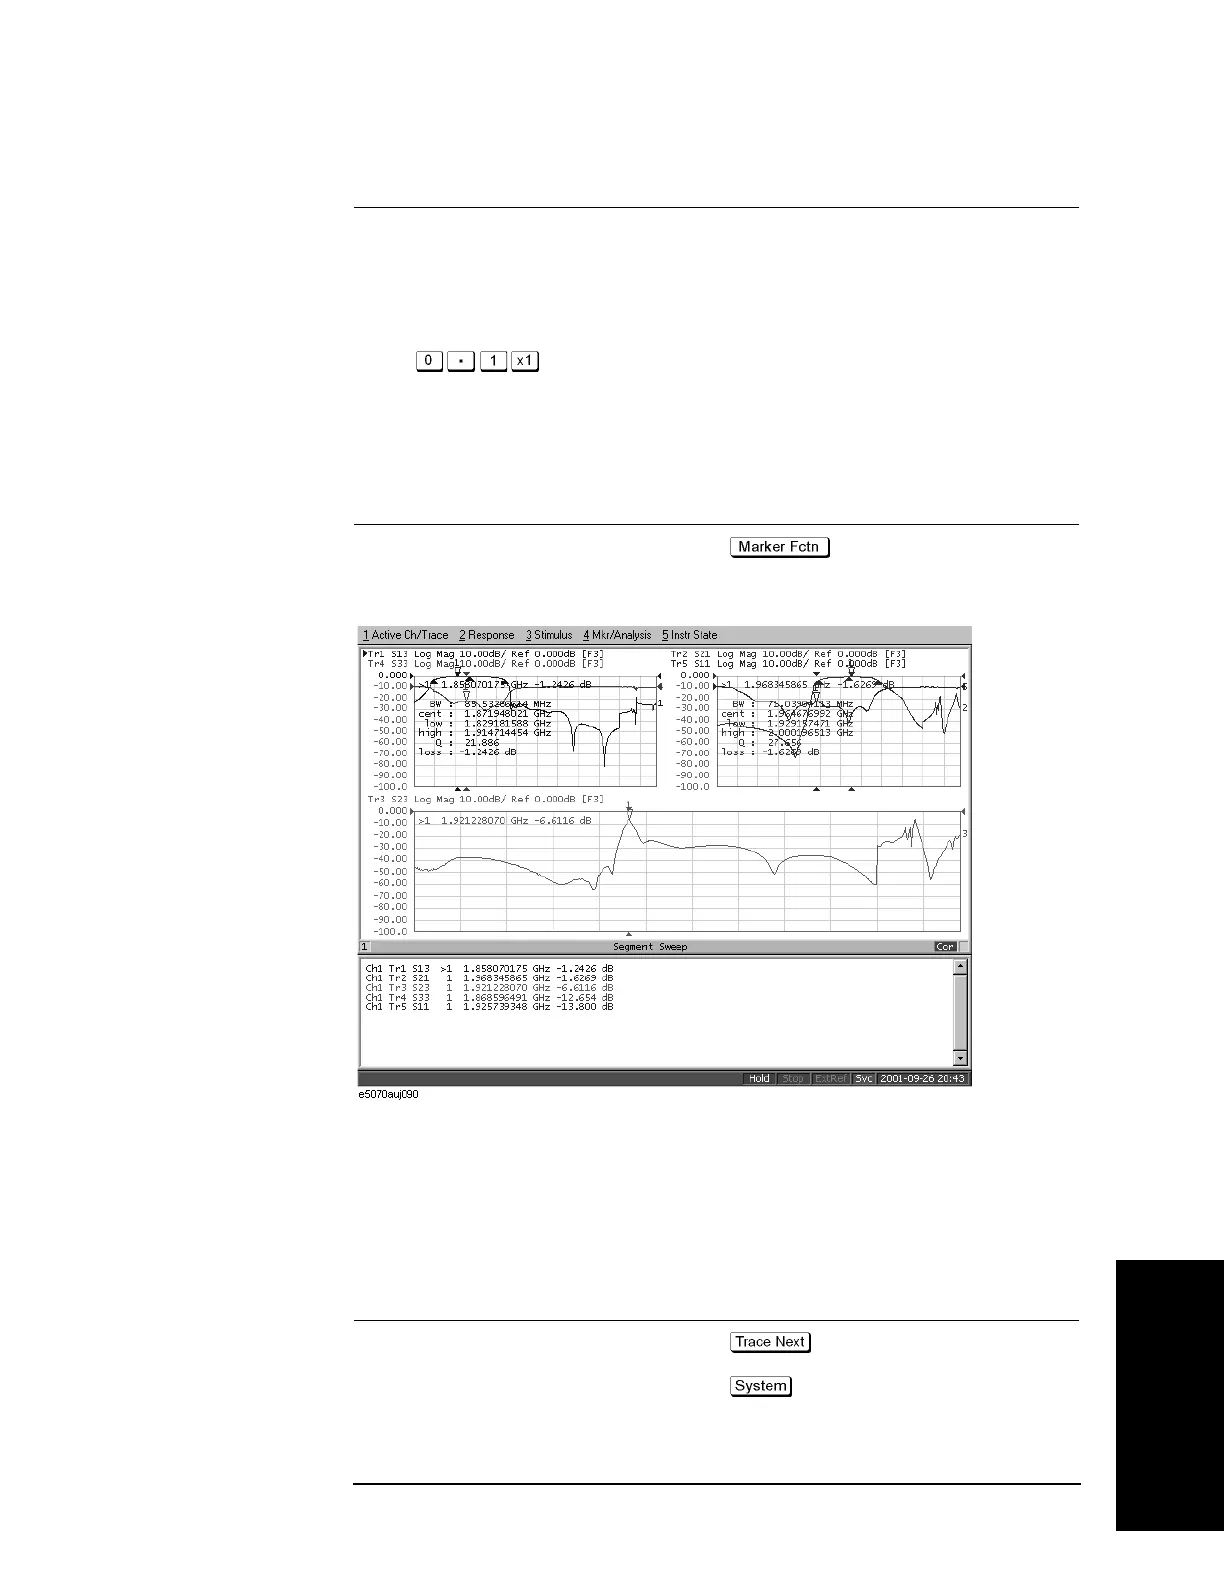
In the example of Figure 15-15, return loss (response value of Marker 1) is 13.80 dB.
Step 6. Turn on the marker table display.
Setup Description Key Operation
Marker table display: ON
- Marker Table (Turn it ON)
Figure 15-15 Analyzing duplexer parameters
10. Define the Setup for a Limit Table
Follow the steps below to make entries in the limit table.
Step 1. Display the limit table for Trace 1 (S
13
).
Setup Description Key Operation
Activating Trace 1
Displaying a limit table
- Limit Test - Edit Limit Line
Moving Marker 1 to the peak in the pass band Peak - Search Left|Search Right (press as
many times as necessary)
*1
*1. If you cannot move the marker to the desired peak, use Peak Excursion to change the
peak deviation and then execute the search again. (Example:
Peak Excursion -
).
Setup Description Key Operation
 Loading...