Chapter 3 83
Setting Measurement Conditions
Selecting a Data Format
3. Setting Measurement
Conditions
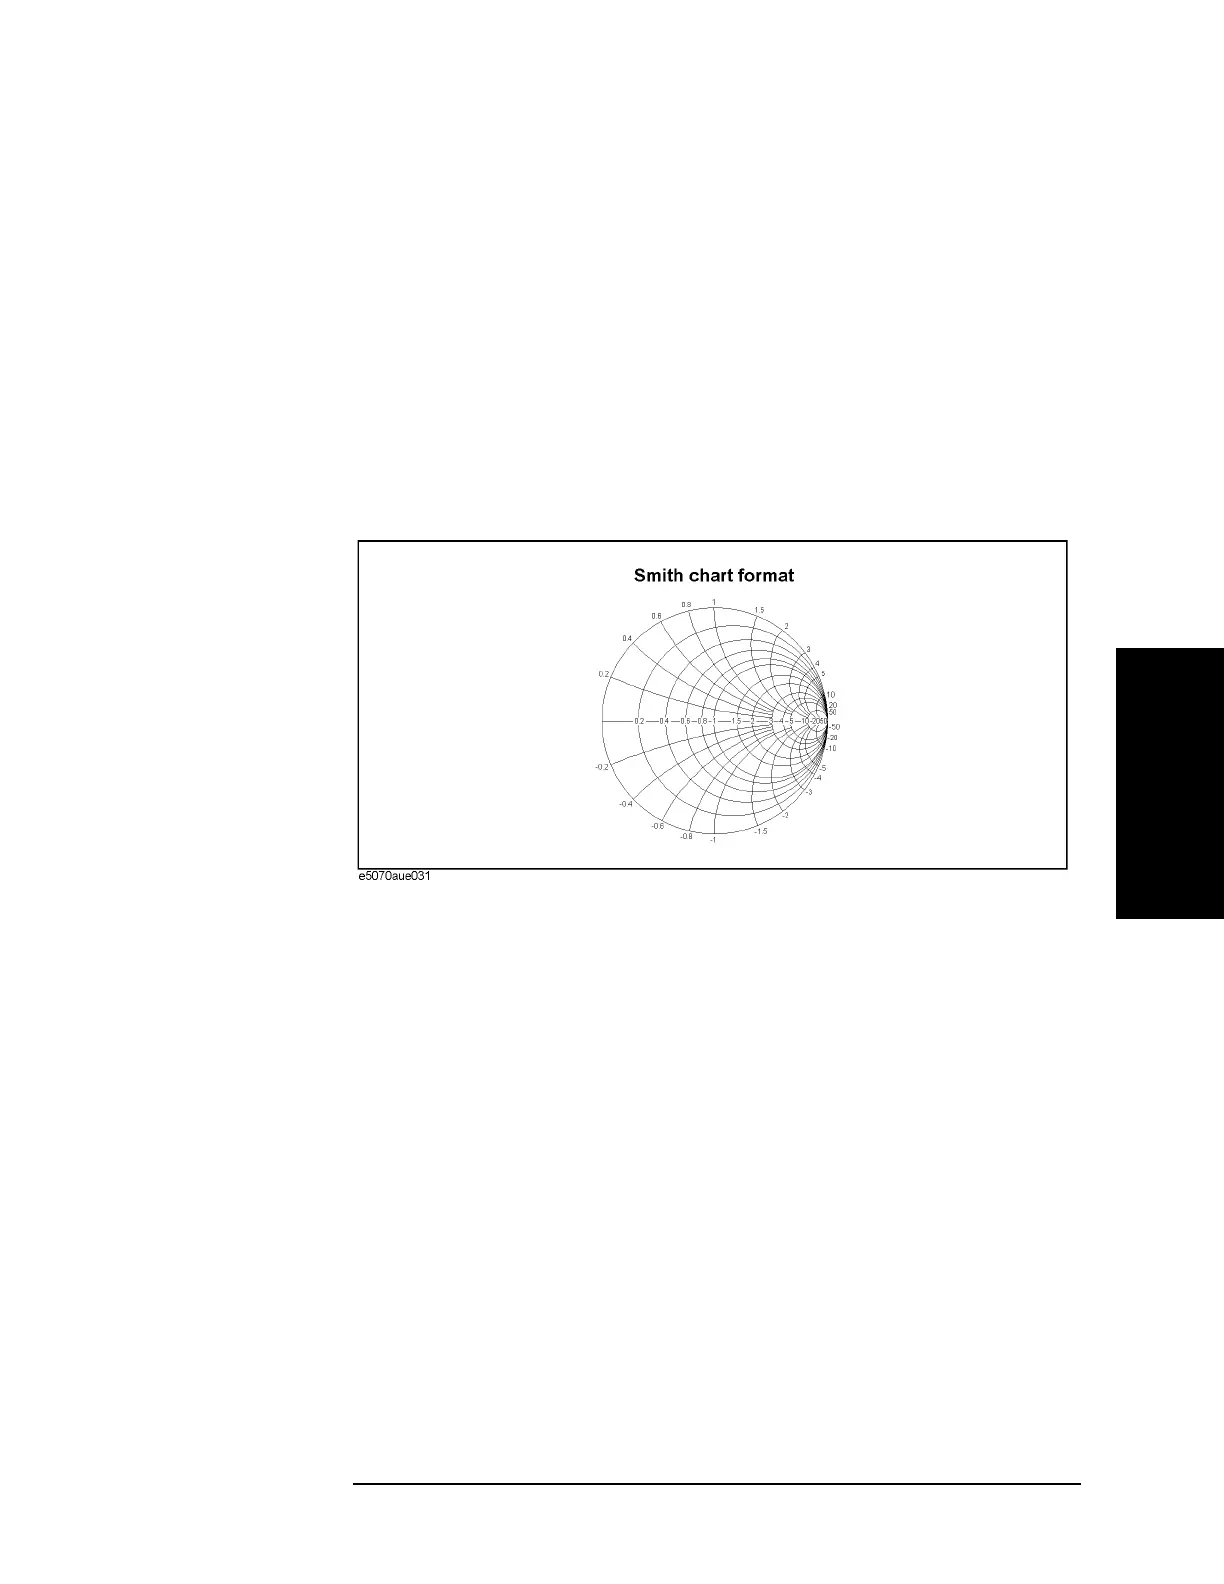
Smith chart format
The Smith chart format is used to display impedances based on reflection measurement
data of the DUT. In this format, traces are plotted at the same spots as in the polar format.
The Smith chart format allows users to select one of the following five data groups for
displaying the marker response values.
• Linear magnitude and phase (°)
• Log magnitude and phase (°)
• Real and imaginary parts
• Resistance (Ω), reactance (Ω), and inductance (H) or capacitance (F)
• Conductance (S), susceptance (S), and capacitance (F) or inductance (H)
Figure 3-10 Smith chart format
 Loading...