272 Chapter 6
Data Analysis
Determining the Mean, Standard Deviation, and p-p of the Trace
Determining the Mean, Standard Deviation, and p-p of the
Trace
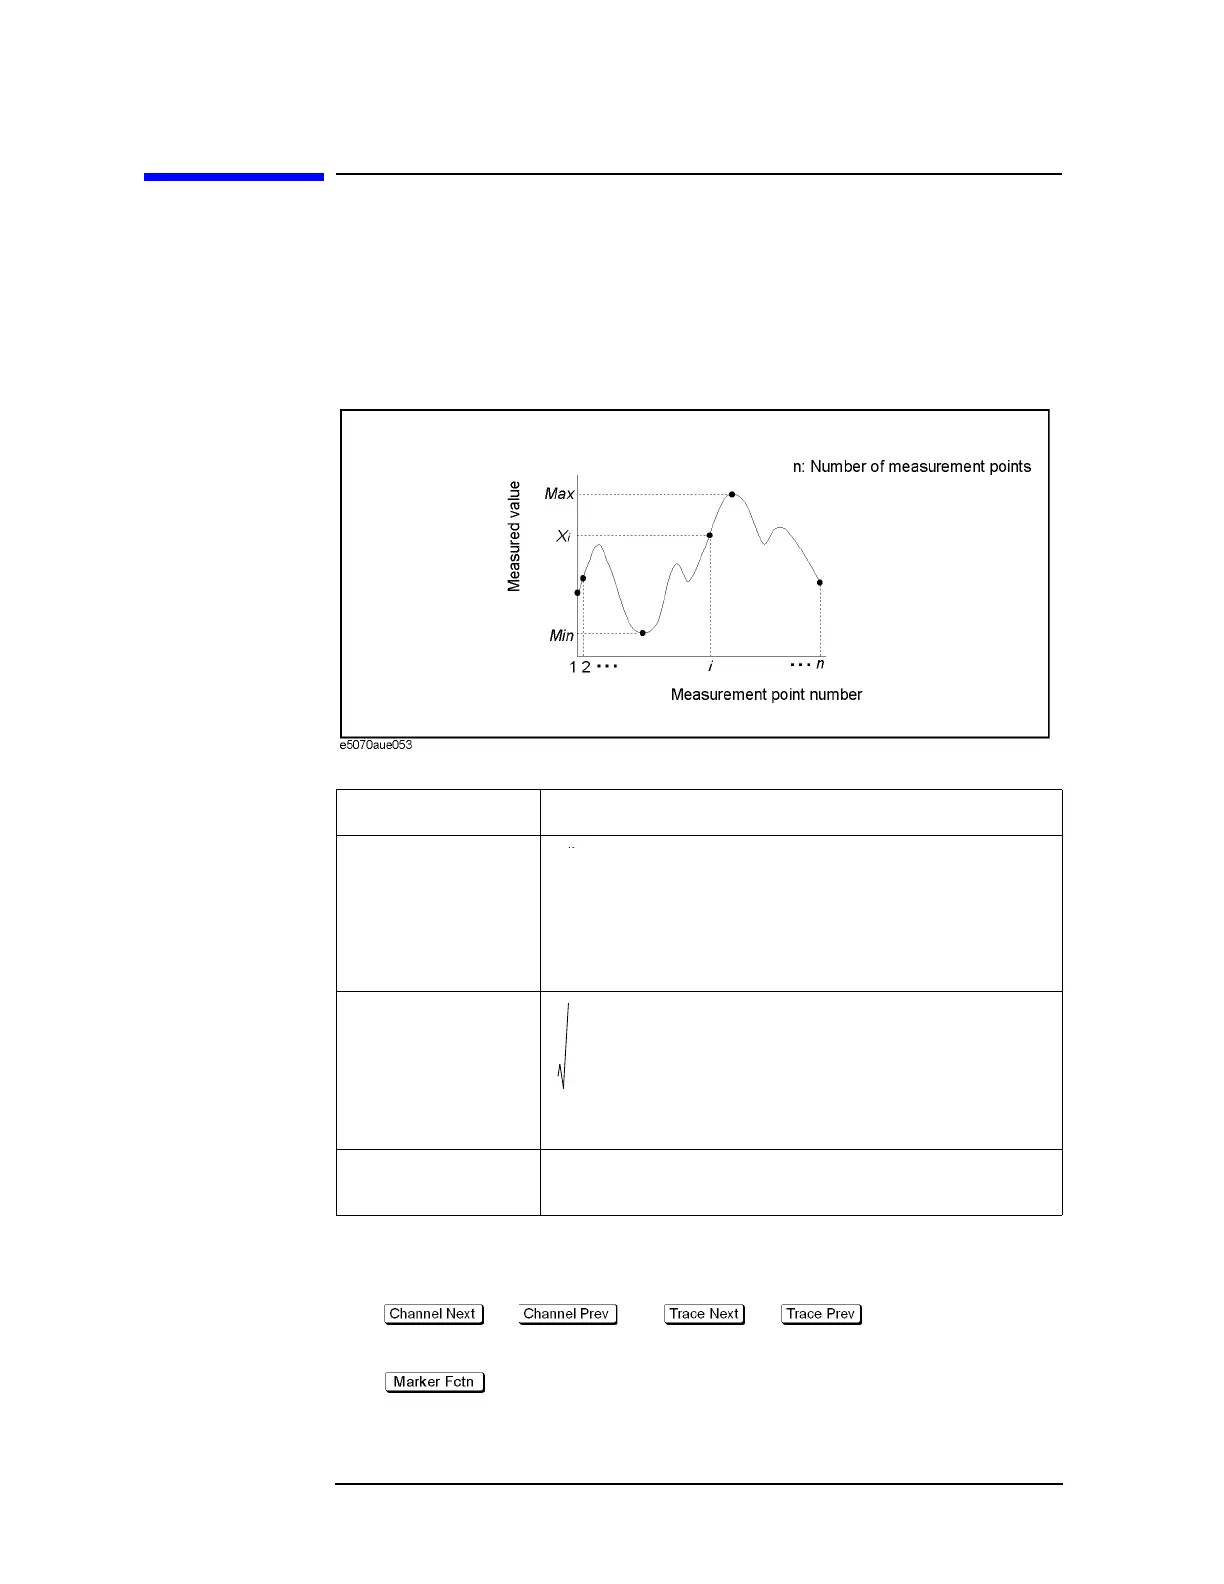
You can easily determine the statistics data for a trace (mean, standard deviation, and
peak-to-peak).
Figure 6-15 and Table 6-3 show the definitions for the statistics data
elements.
Figure 6-15 Parameters used for calculating statistics data
Table 6-3 Definitions of Statistics Data
Statistics data element Definition
Mean (mean)
x
i
i 1=
∑
n
--------------
(n: number of points; x
i
: measured value at the i-th measurement
point)
Standard deviation
(s. dev)
x
i
mean–〈〉
2
i 1=
∑
n 1–
------------------------------------------
(n: number of points; x
i
: measured value at the i-th measurement
point; mean: Mean)
Peak-to-peak (p - p)
Max Min–
(Max: greatest measured value; Min: smallest measured value
Displaying Statistics Data
Step 1. Press (or ) and (or ) to activate the trace for
which statistics data is required.
Step 2. Press .
Step 3. Press Statistics to turn on the display of statistics data.
 Loading...