Chapter 15 505
Measurement Examples
Measuring the Deviation from a Linear Phase
15. Measurement Examples
Measuring the Deviation from a Linear Phase
This section illustrates how to determine the deviation from a linear phase in the pass band
of a 1.09-GHz bandpass filter.
Evaluation Steps
Here, the DUT is evaluated by following the steps described in Table 15-5.
Table 15-5 Evaluating the Deviation from a Linear Phase
Step Description
“1. Connect the DUT” on page 505 The DUT is connected.
“2. Define the Measurement Conditions” on
page 506
The measurement conditions are defined.
“3. Execute the Calibration” on page 506 The calibration is executed.
“4. Connect the DUT and Execute the Auto
Scale” on page 506
The DUT is connected again to execute the auto scale
function.
“5. Specify the Electrical Delay” on page 507 The electrical delay is specified.
“6. Measure the Deviation from a Linear
Phase” on page 508
The statistics data function (peak-to-peak) is used to
determine the deviation from a linear phase.
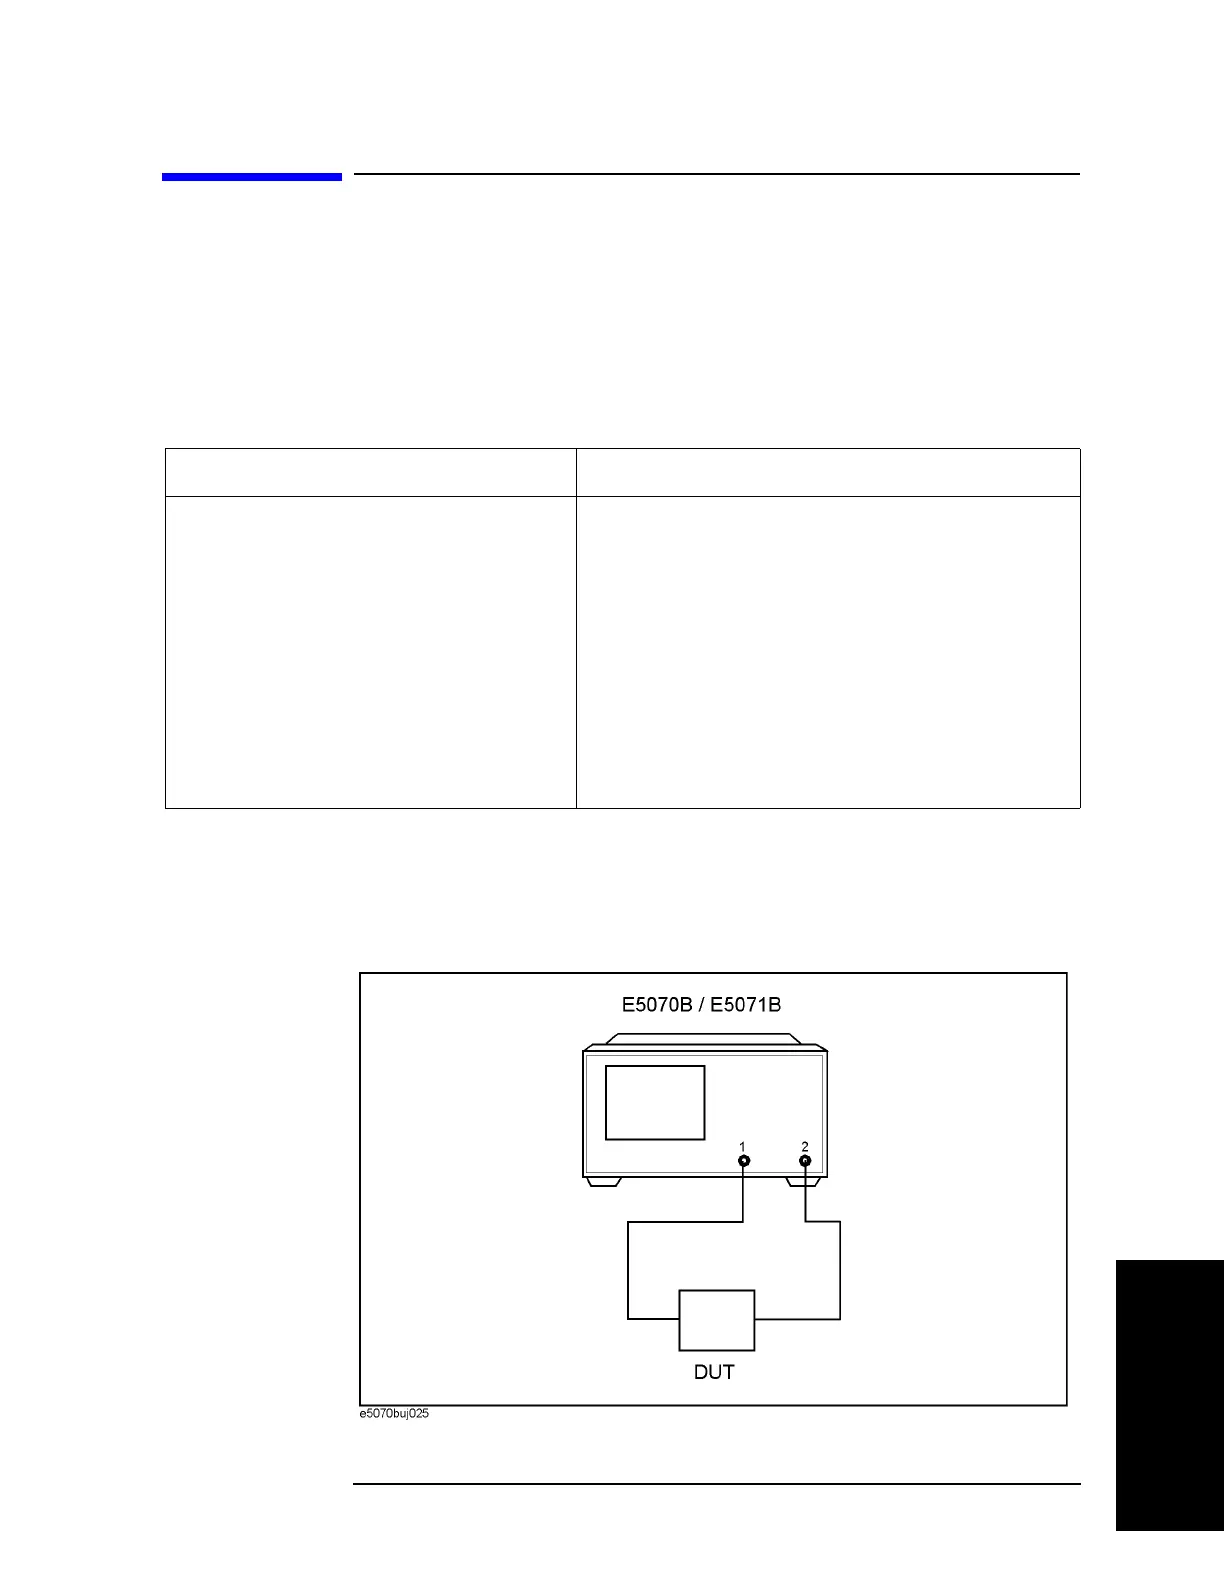
1. Connect the DUT
Connect the DUT as shown in Figure 15-21.
Figure 15-21 Connecting the DUT
 Loading...