Chapter 3 81
Setting Measurement Conditions
Selecting a Data Format
3. Setting Measurement
Conditions
Selecting a Data Format
The E5070B/E5071B allows you to display measured S-parameters by using the following
data formats:
R Rectangular display formats
• Log magnitude format
•Phase format
• Expanded phase format
• Positive phase format
• Group delay format
• Linear magnitude format
• SWR format
• Real format
• Imaginary format
R Polar format
R Smith chart format
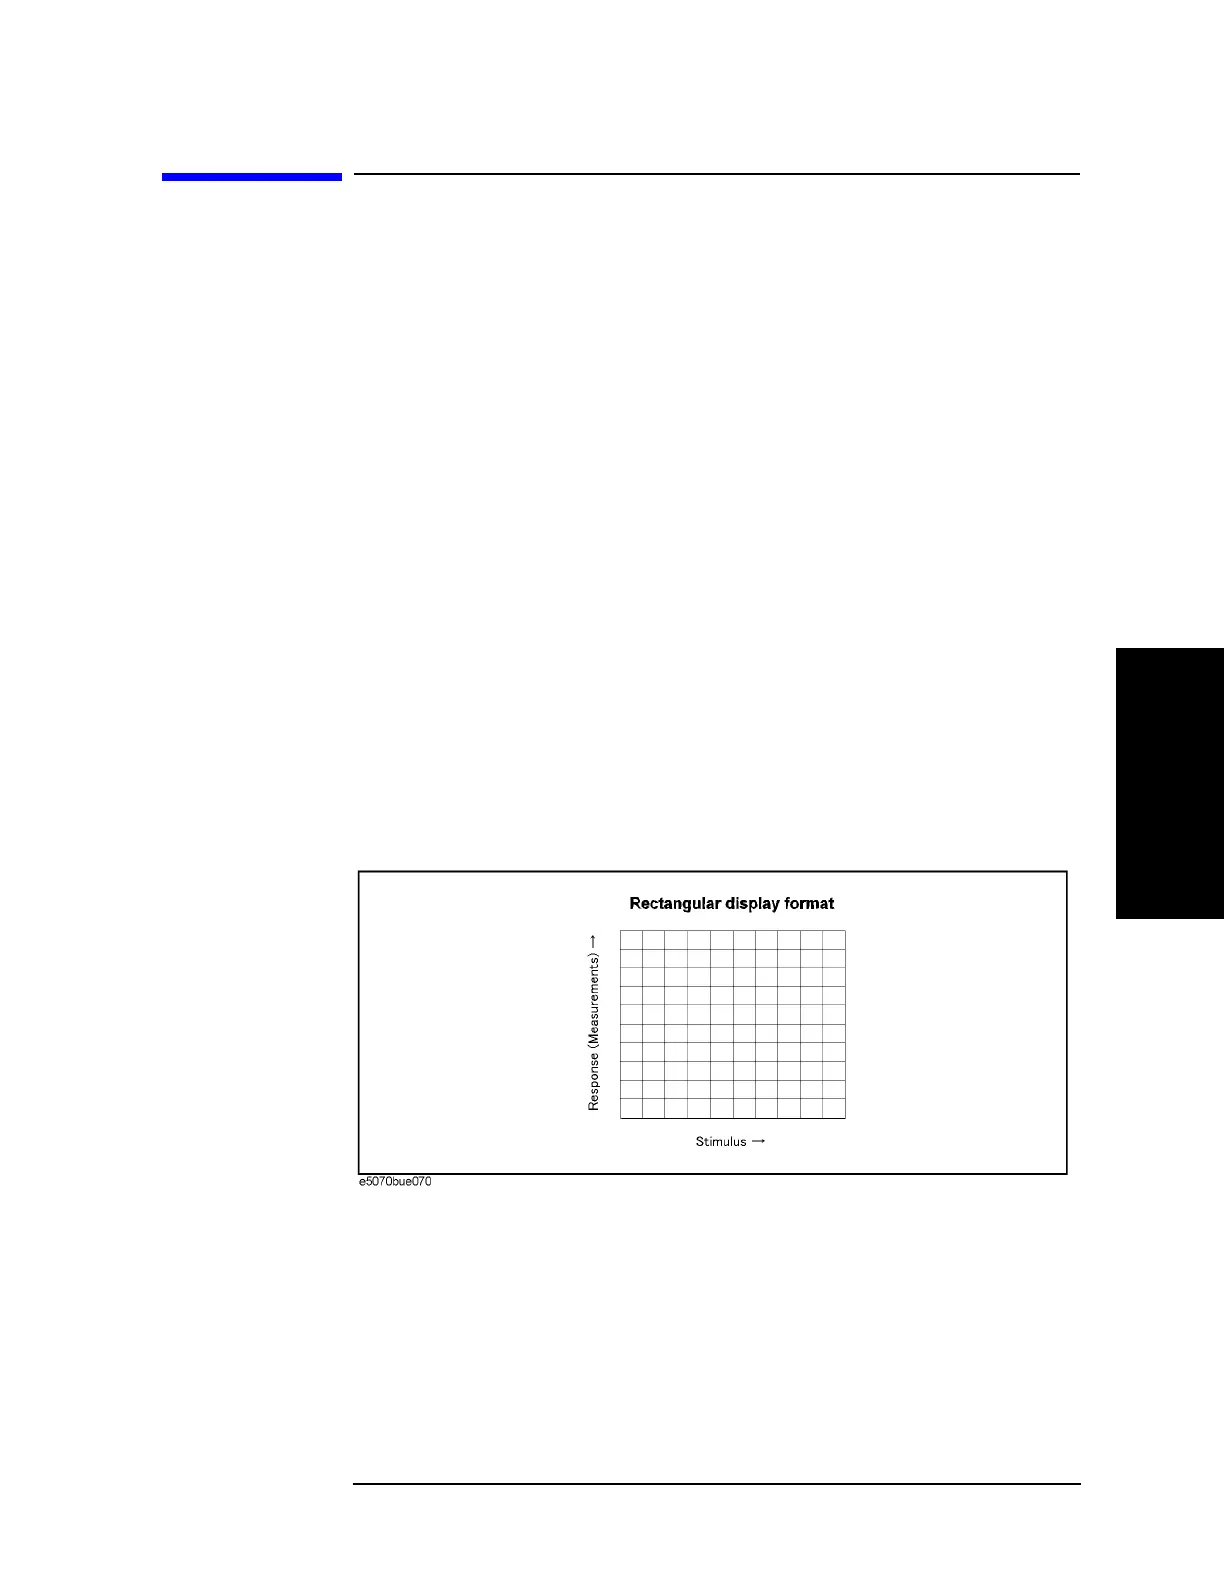
Rectangular display formats
Rectangular display formats draw traces by assigning stimulus values (linear scale) to the
X-axis and response values to the Y-axis (
Figure 3-8). Eight different formats are available
depending on the selection of data for the Y-axis (Table 3-3).
Figure 3-8 Rectangular display format
 Loading...