To generate trunk utilization statisticsServer Reporting
............................................................................................................................................................................................................................................................
8AL90208USAD ed01
November 20, 2008
6-5
............................................................................................................................................................................................................................................................
........................................................................................................................................................................................................................
4 Select an interval from the drop-down list. (15 minutes; 30 minutes; 1 hour)
........................................................................................................................................................................................................................
5 Type the Trunk Number.
........................................................................................................................................................................................................................
6 Click the View button.
A report histogram appears.
........................................................................................................................................................
E ND OF STEPS
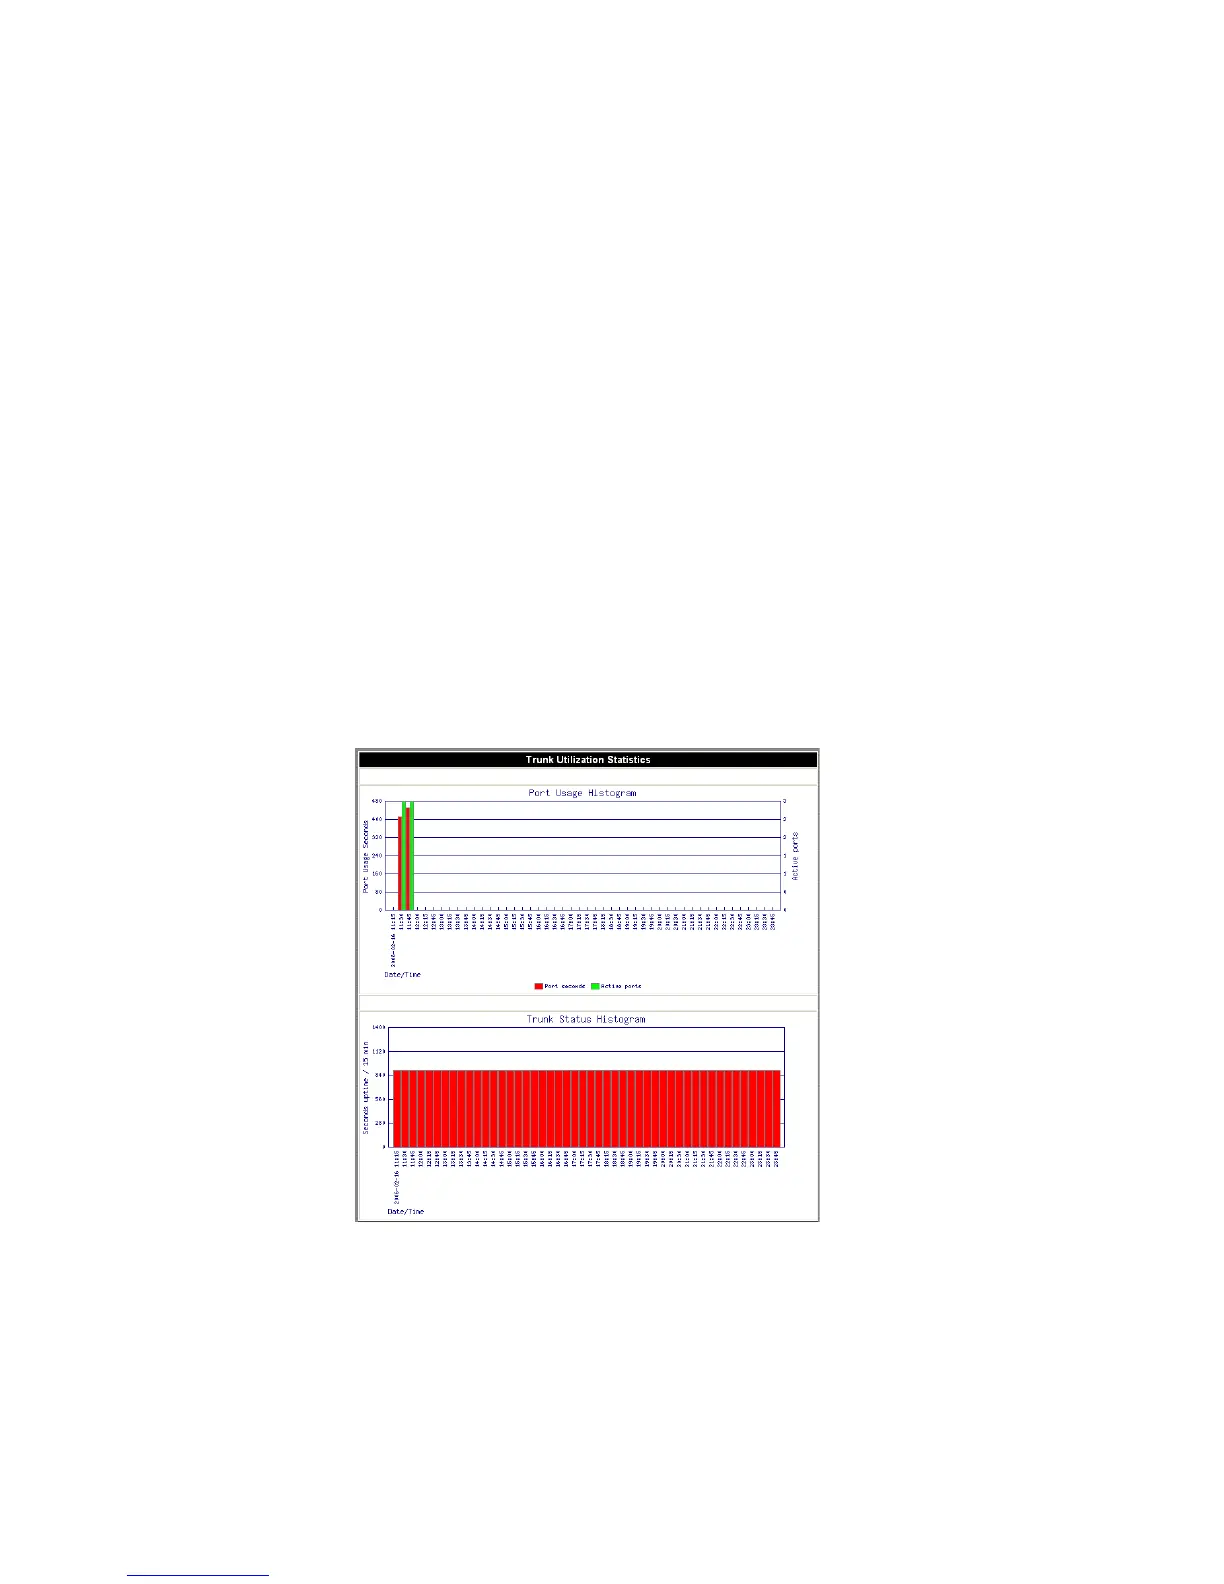
The trunk utilization graph displays the PSTN port usage of the server for the date and
time range you select. This menu choice generates a bar chart that provides both number
of ports and number of port seconds for the selected time increments in the selected date
range. This is useful for monitoring capacity utilization of the server over time.
Figure 6-5 Trunk Utilization Histogram