............................................................................................................................................................................................................................................................
VoIP utilization statisticsServer Reporting
6-6
8AL90208USAD ed01
November 20, 2008
............................................................................................................................................................................................................................................................
VoIP utilization statistics
In systems configured to handle VoIP traffic (from SIP phones or gateways, for example),
you can generate reports on VoIP “port” utilization. In this case, “ports” are VoIP RTP
voice streams.
To select the time range for which you want to review VoIP
utilization
........................................................................................................................................................................................................................
1 Click the Reporting tab.
........................................................................................................................................................................................................................
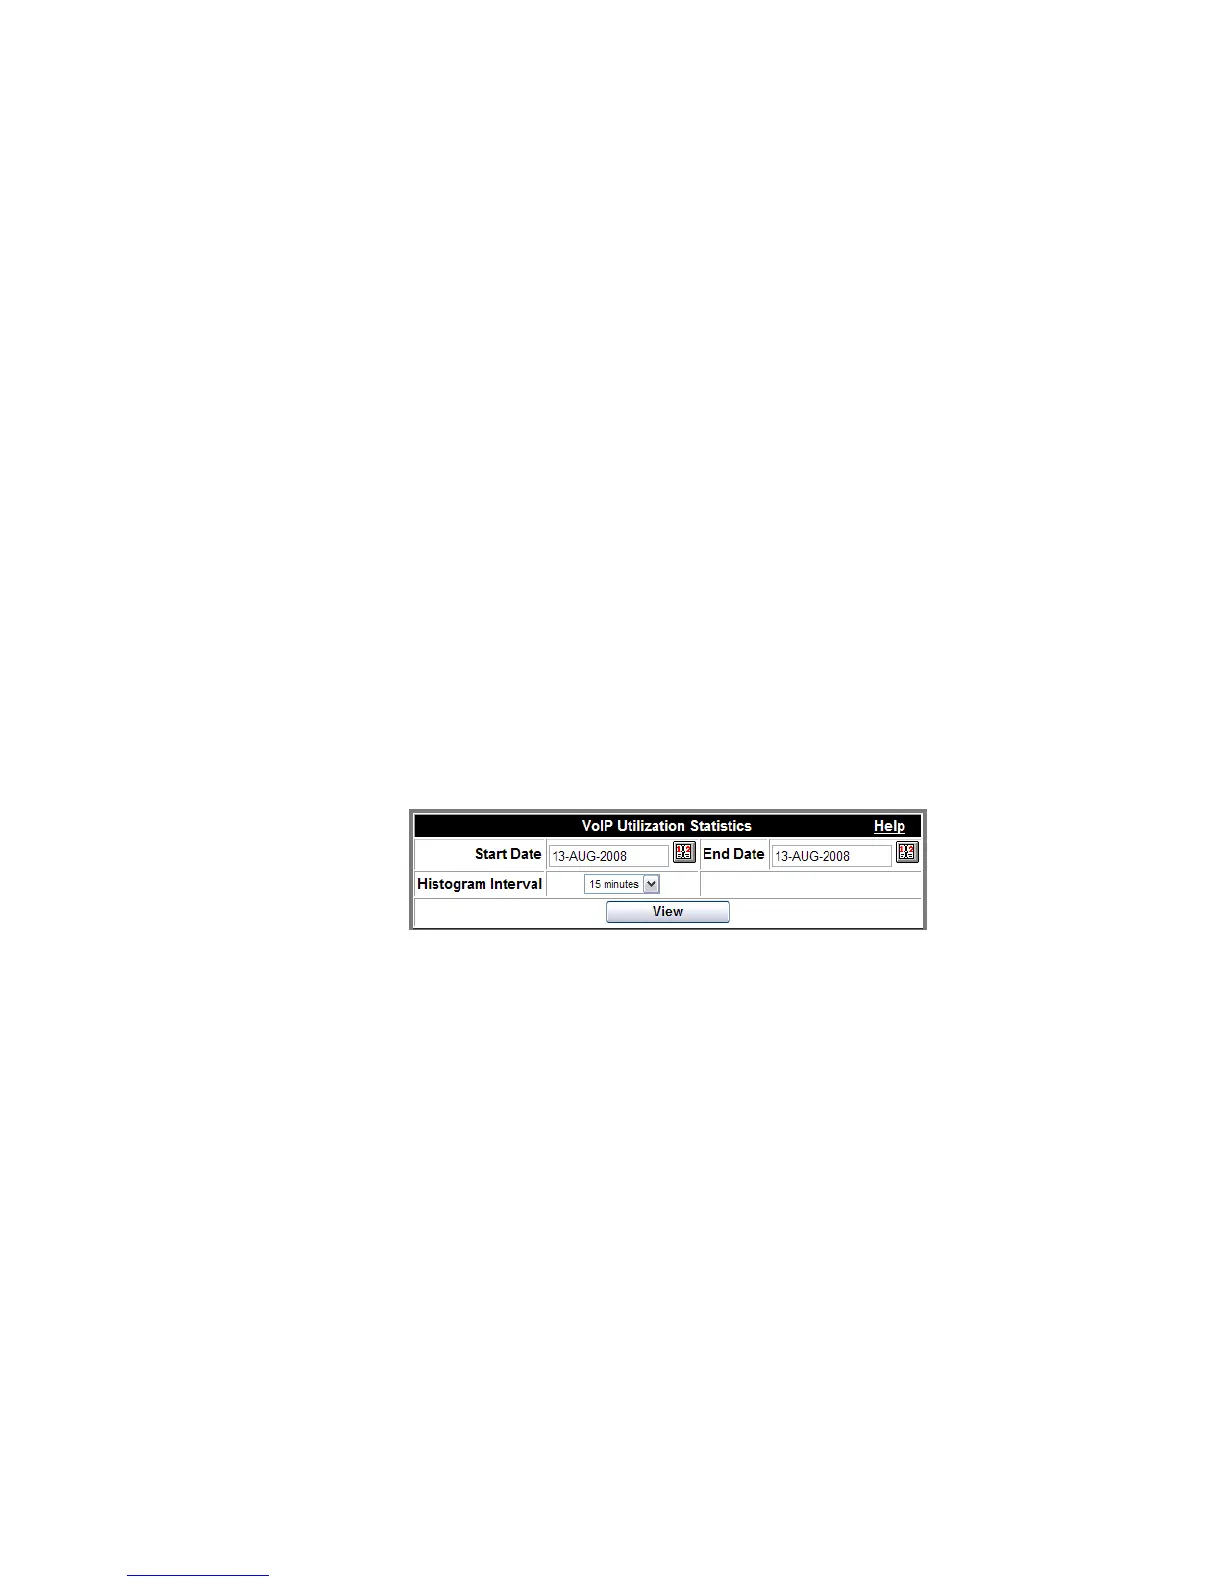
2 Click the VoIP Utilization Statistics item.
A date range selection dialog box appears.
Figure 6-6 View VoIP Utilization
........................................................................................................................................................................................................................
3 Select the date range and the data time interval that you desire.
(15 minutes; 30 minutes; 1 hour)
........................................................................................................................................................................................................................
4 Click View.
A histogram like the following appears. The green bars show the number of active ports
(streams) during a specific time slot. The red bars show the number of occupied port
(stream) seconds.
........................................................................................................................................................
E ND OF STEPS