Receiver Mode
R&S
®
ESR
153User Manual 1175.7068.02 ─ 12
You can access the Color Mapping dialog via the "Color Mapping" softkey or by tap-
ping on the color map. For the spectrogram the R&S ESR maps power levels (dBm).
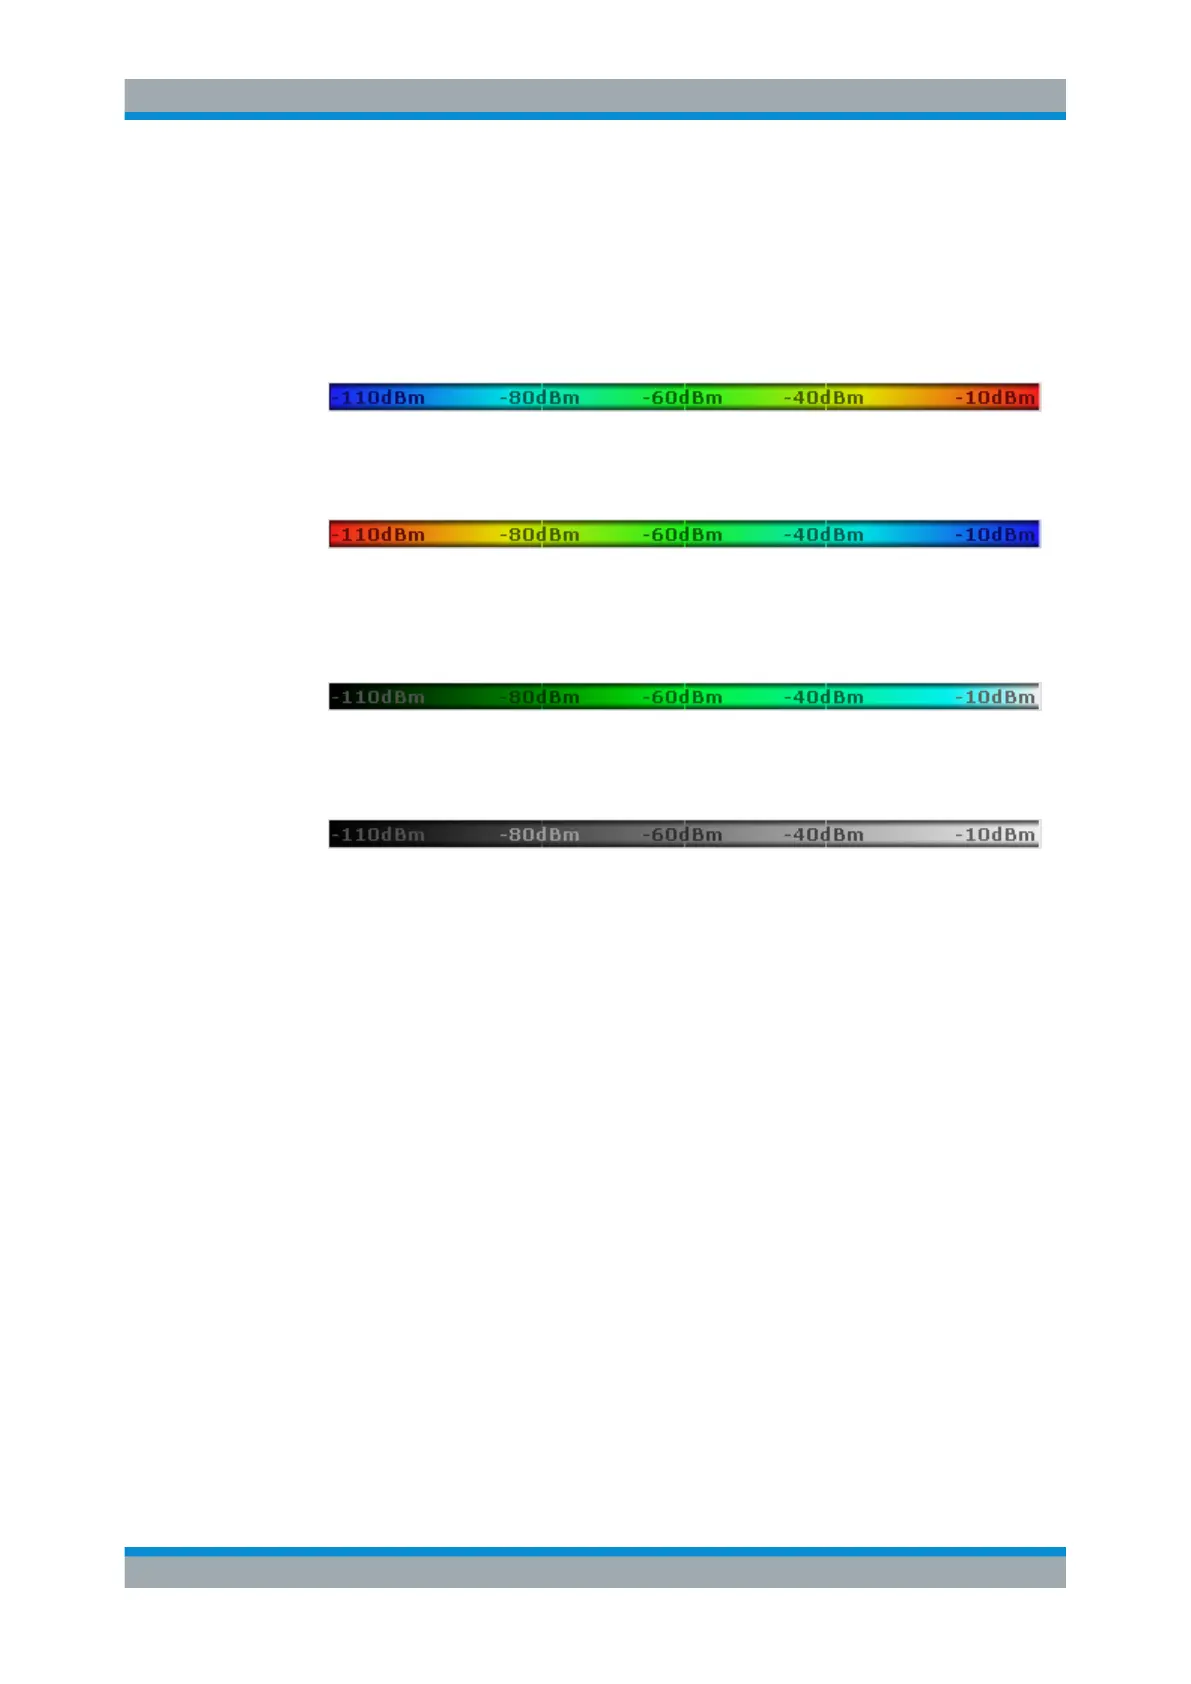
Selecting the color scheme
Before adjusting the details of the color map, you should select the color scheme you
are most comfortable with. You can select from four different color schemes:
●
The "Hot" color scheme shows the results in colors ranging from blue to red. Blue
colors indicate low probabilities or levels respectively. Red colors indicate high
ones.
●
The "Cold" color scheme shows the results in colors ranging from red to blue. Red
colors indicate low probabilities or levels respectively. Blue colors indicate high
ones.
The "Cold" color scheme is the inverse "Hot" color scheme.
●
The "Radar" color scheme shows the colors ranging from black over green to light
turquoise with shades of green in between. Dark colors indicate low probabilities or
levels respectively. Light colors indicate high ones.
●
The "Grayscale" color scheme shows the results in shades of gray. Dark grays indi-
cate low probabilities or levels respectively. Light grays indicate high ones.
If a result lies outside the defined range of the color map, it is colored in black at the
lower end of the color range. On the upper end of the color range it is always the light-
est color possible, regardless of differences in amplitude (e.g. black and blue in case of
the "Cold" scheme).
Defining the Range of the Color Map
The current configuration could be a color map that you can optimize for better visuali-
zation of the measured signal, for example if the results cover only a small part of the
color map. In the resulting trace, it would be hard to distinguish between values that
are close together.
There are several ways to optimize the distribution of the colors over the results and
then get the best viewing results.
Note that the following examples are based on the "Hot" color scheme.
The easiest way to adjust the colors is to use the color range sliders in the "Color Map-
ping" dialog.
In the histogram that is in the background of the color curve pane (grey bars), you can
observe the distribution of measurement results. If no significant shifts in result distribu-
tion occur after evaluating this for a time, you can adjust the color map to the overall
Measurements and Result Displays

 Loading...

