Receiver Mode
R&S
®
ESR
154User Manual 1175.7068.02 ─ 12
shape of the measurement results. To do so and still cover the whole signal, move the
sliders in a way that the first and last bar of the histogram are still inside the range. You
can optimize the display further, if you suppress the noise by excluding the lower 10 to
20 dB of the distribution. Note that the color map has to cover at least 10% of the
range of the horizontal axis.
Alternatively, you can set the range in the numeric input field. In that field, you have to
enter the distance from the right and left border as a percentage.
Example:
The color map starts at -100 dBm and ends at 0 dBm (i.e. a range of 100 dB). You,
however, want the color map to start at -90 dBm. To do so, you have to enter 10% in
the Start field. The R&S ESR shifts the start point 10% to the right, to -90 dBm.
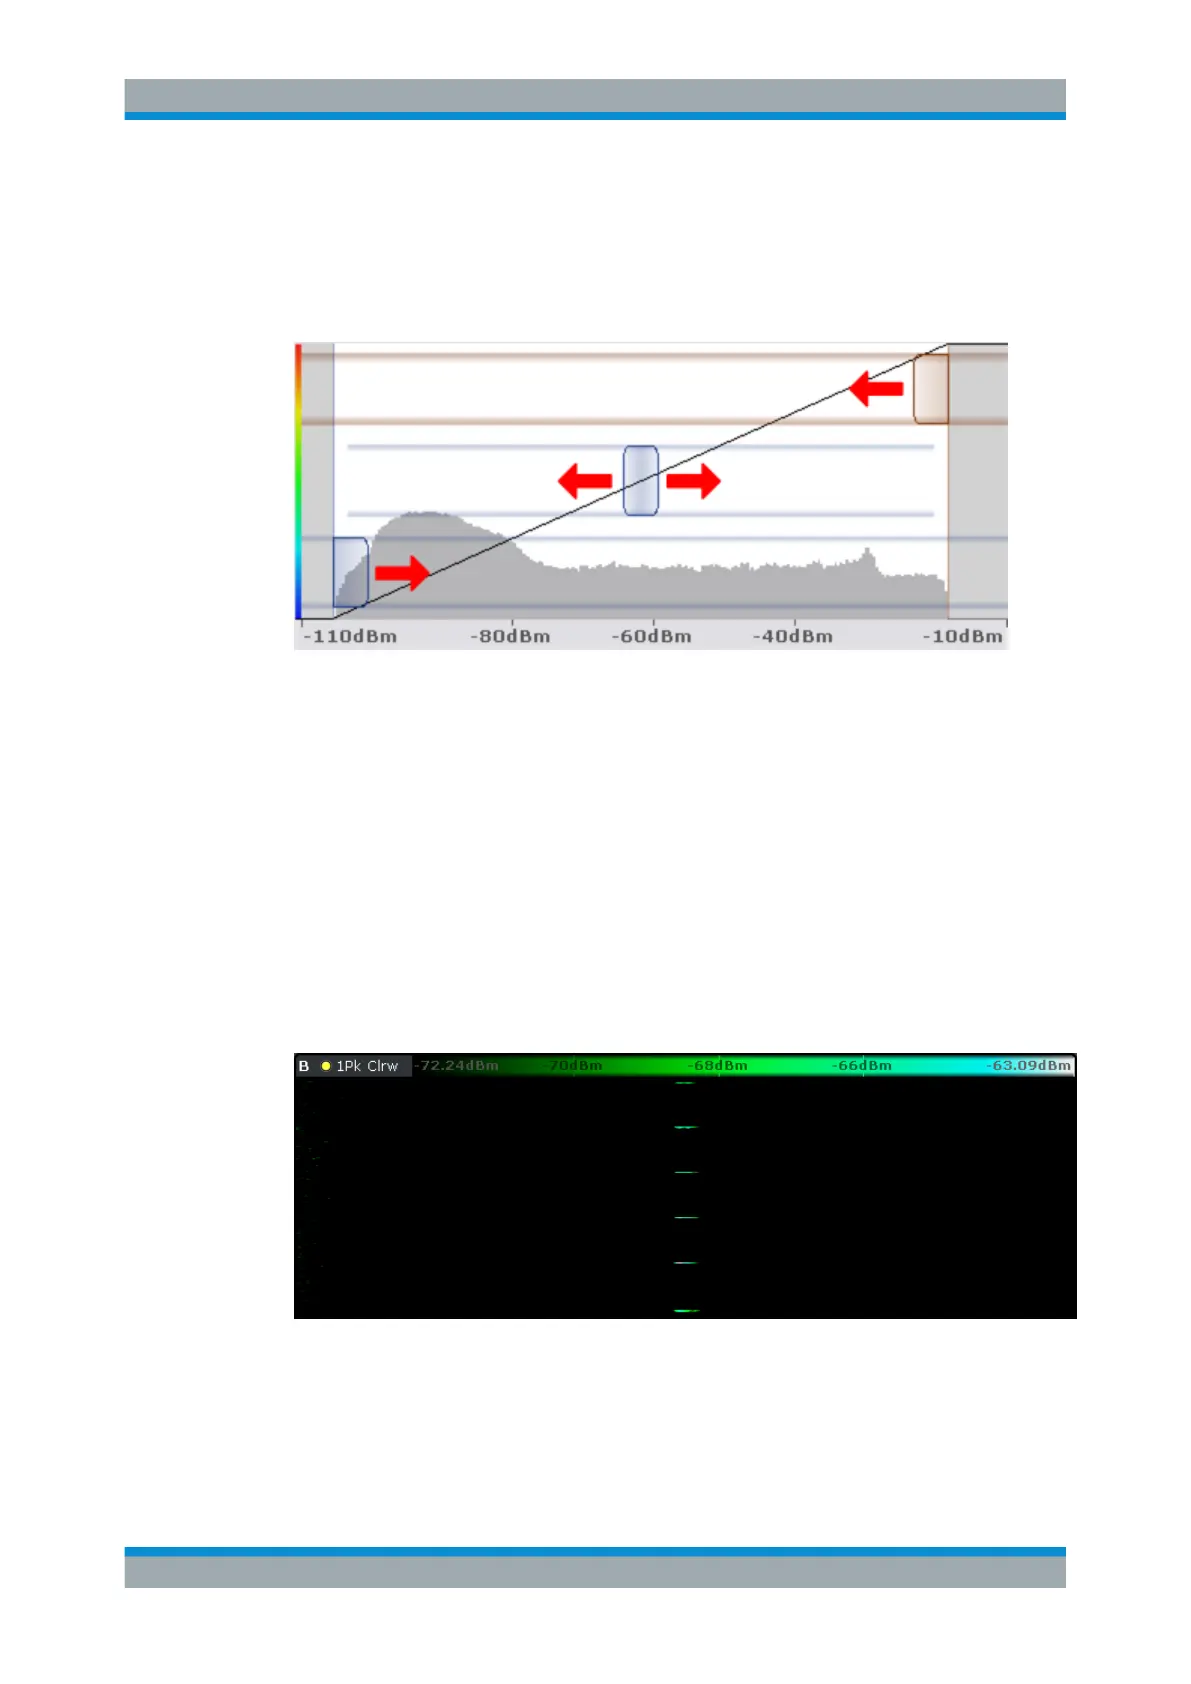
In the spectrogram, cutting the range as far as possible is also a good way if you want
to observe and put the focus on signals with a certain amplitude only. Then, only those
signal amplitudes that you really want see are displayed. The rest of the display
remains dark (or light, depending on the color scheme). It is also a good way to elimi-
nate noise from the display. In the spectrogram you can do this easily by excluding the
corresponding power levels at the low end of the power level distribution.
Figure 5-2: Spectrogram that shows the peaks of a pulsed signal only
Measurements and Result Displays

 Loading...

