Spectrum Measurements
R&S
®
ESR
314User Manual 1175.7068.02 ─ 12
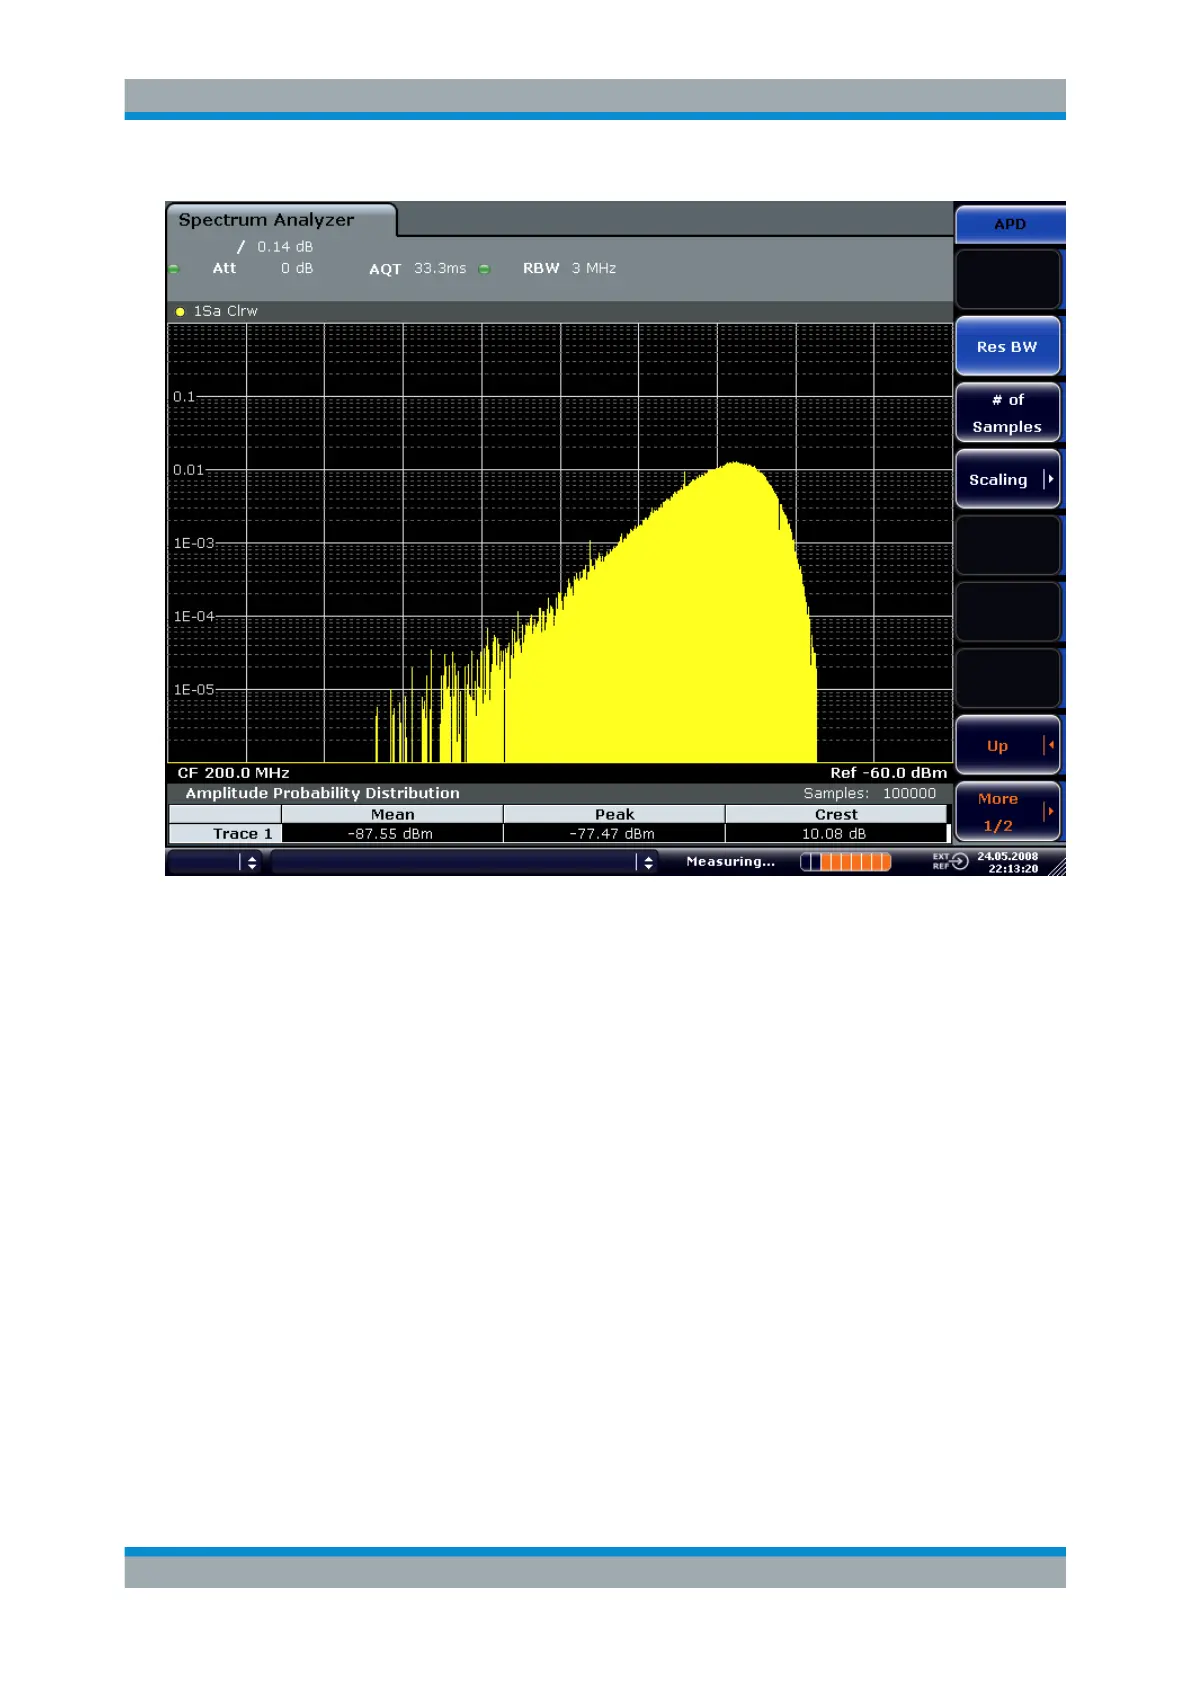
Figure 6-7: Amplitude probability distribution of white noise
In addition to the histogram, a result table is displayed containing the following informa-
tion:
●
Number of samples used for calculation
●
For each displayed trace:
– Mean amplitude
– Peak amplitude
– Crest factor
Complementary Cumulative Distribution Function (CCDF)
The Complementary Cumulative Distribution Function (CCDF) shows the probability
that the mean signal power amplitude will be exceeded in percent. The level above the
mean power is plotted along the x-axis of the graph. The origin of the axis corresponds
to the mean power level. The probability that a level will be exceeded is plotted along
the y-axis.
Measurements

 Loading...

