Spectrum Measurements
R&S
®
ESR
315User Manual 1175.7068.02 ─ 12
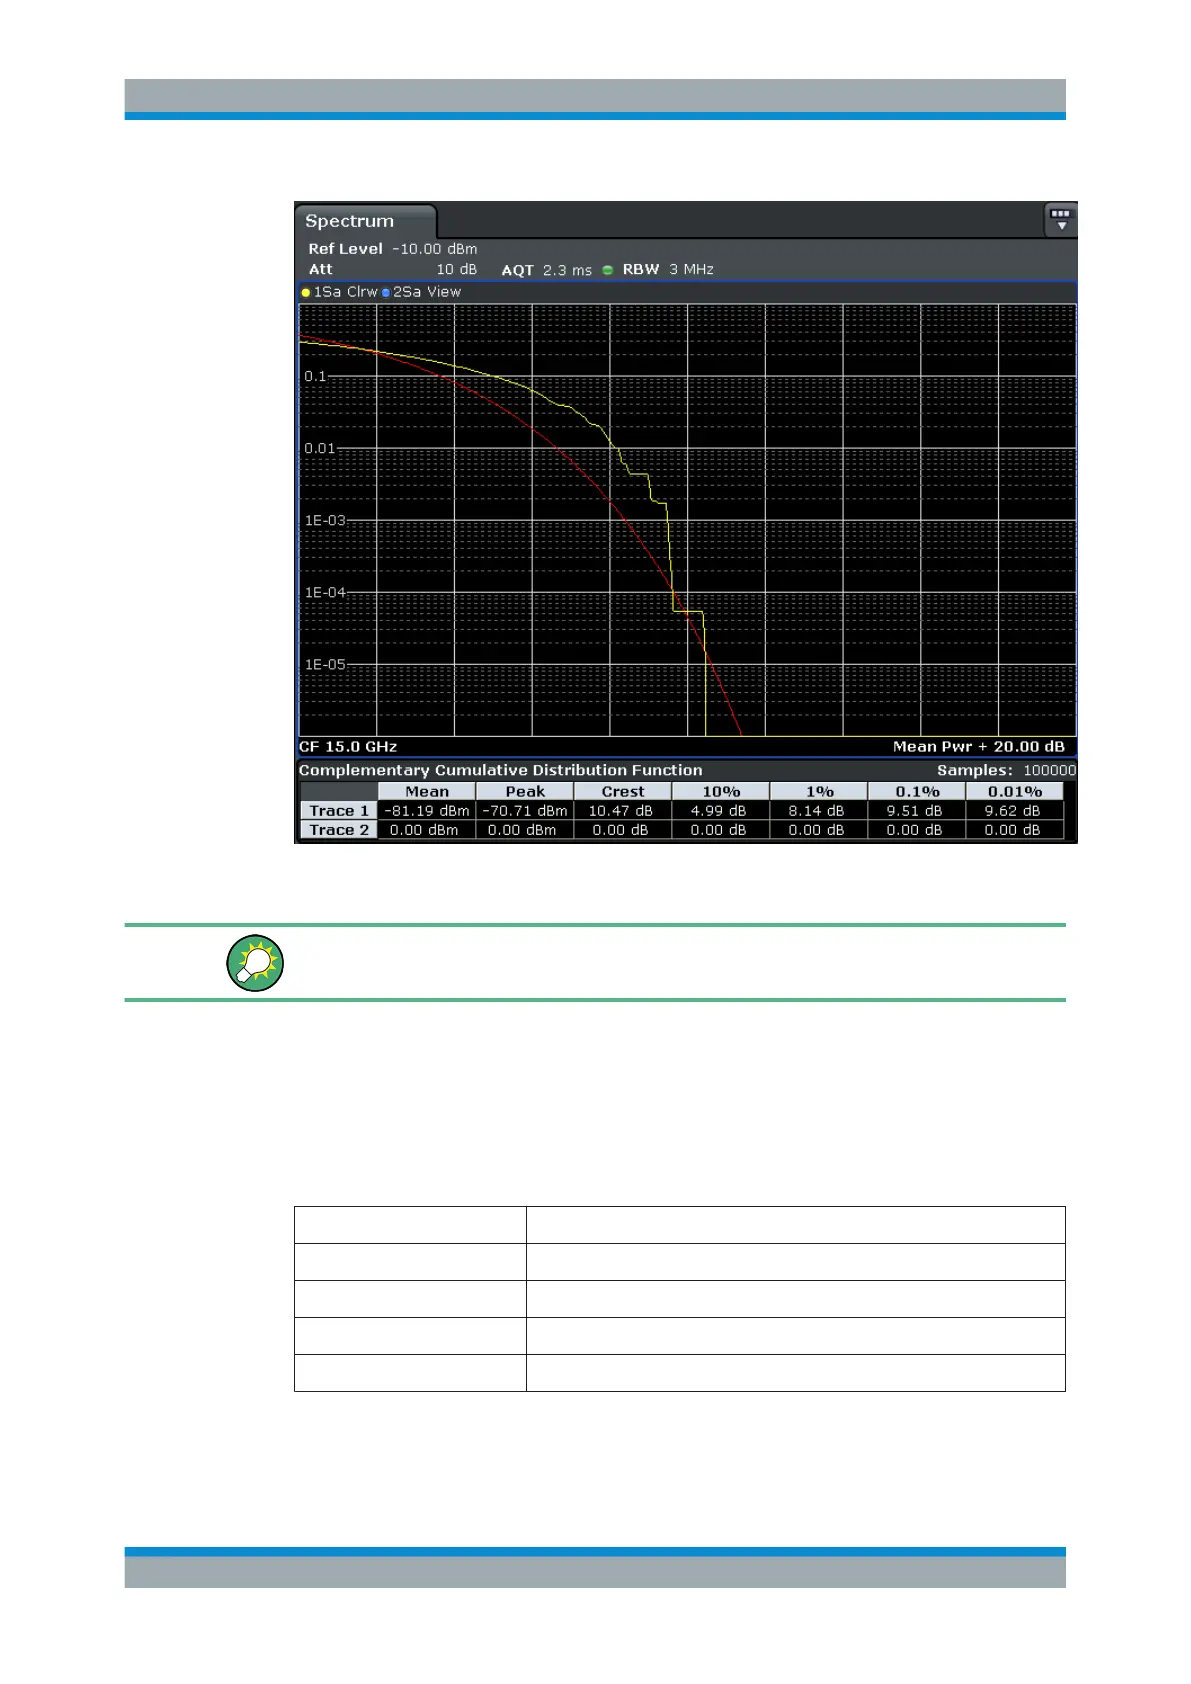
Figure 6-8: CCDF of white noise
A red line indicates the ideal Gaussian distribution for the measured amplitude range
(white noise).
The displayed amplitude range is indicated as "Mean Pwr + <x dB>"
In addition to the histogram, a result table is displayed containing the following informa-
tion:
●
Number of samples used for calculation
●
For each displayed trace:
Mean Mean power
Peak Peak power
Crest Crest factor (peak power – mean power)
0,01 % Level values over 0,01 % above mean power
0,1 % Level values over 0,1 % above mean power
Measurements

 Loading...

