Spectrum Measurements
R&S
®
ESR
398User Manual 1175.7068.02 ─ 12
means that with linear level display the average is formed over linear amplitude values.
The sweep mode (continuous or single sweep, for details see Chapter 6.2.7, "Configur-
ing the Sweep Mode – SWEEP Key", on page 369) and running averaging apply to the
average display analogously. In principle, two methods for calculating the average are
used: continuous averaging and averaging over the selected number of sweeps.
●
sweep count > 1
Depending on the relation of the following two parameters, two different situations
exist:
n = number of sweeps performed since measurement start
c = sweep count (number of sweeps forming one statistics cycle)
– n ≤ c
In single sweep or continuous sweep mode during the first statistics cycle,
averaging over the selected number of sweeps is performed. The average
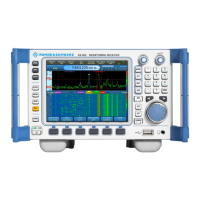
trace "n" is calculated at each measurement point according to:
Figure 6-17: Equation 1
with Avg = average trace; Curr = current trace
Until the first statistics cycle is completed (n < c), a preliminary average is dis-
played which represents the arithmetic mean value over all measured sweeps.
With n increasing, the displayed trace is increasingly smoothed since there are
more single sweeps for averaging.
When the first statistics cycle is completed (n = c), the average trace is saved
in the trace memory.
– n > c
In continuous sweep mode after the first statistics cycle, continuous averaging
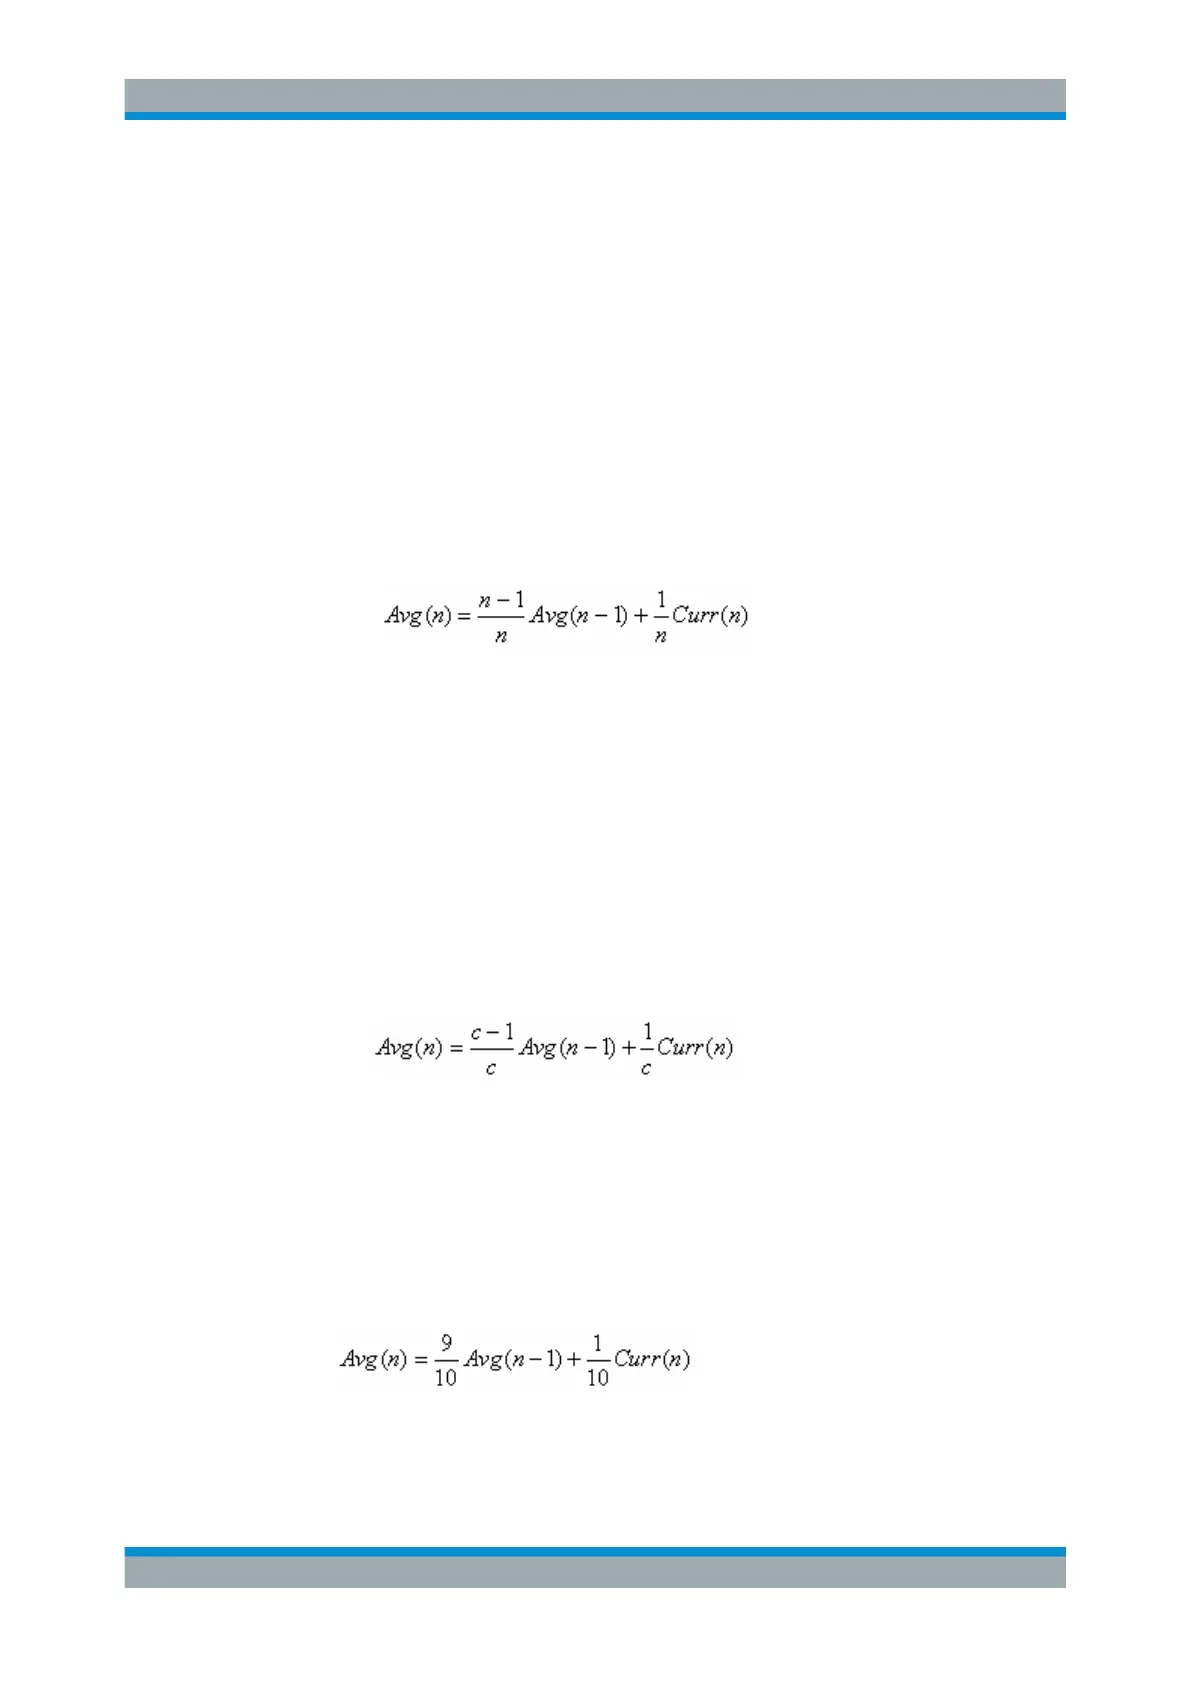
is performed. The average trace "n" is calculated at each measurement point
according to:
Figure 6-18: Equation 2
with Avg = average trace; Curr = current trace
In single sweep mode, the same formula is valid if the Continue Single Sweep
softkey is pressed.
●
sweep count = 0
In continuous sweep mode, a continuous average is calculated according to Fig-
ure 6-18 with c = 10:
Figure 6-19: Equation 3
Analysis
 Loading...